Media Consumption
Levels Of Trust In News & Information Sources, January 2014 [CHART]
65% of informed publics trust traditional media, with an equal share trusting online search engines.
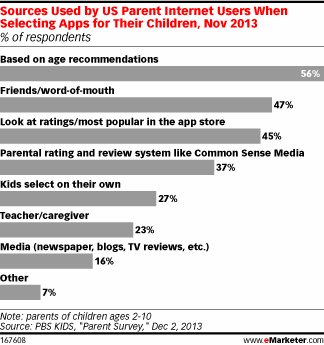
Read MoreHow Parents Select Mobile Apps For Their Kids, November 2013 [CHART]
Fifty-six percent of respondents looked for apps suitable for their kids’ ages.
Read MoreTV Viewers & Multitasking, January 2014 [VIDEO]
New survey data from TiVo suggests that viewers themselves believe they’re primarily paying attention to the box.
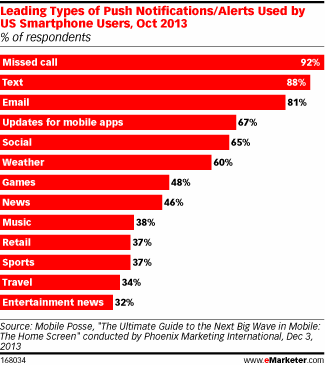
Read MoreMost Used Mobile Notifications, October 2013 [CHART]
On average, smartphone users had signed up for at least one notification from eight of the 14 categories included in the survey.
Read MoreOnline Behavior Of The Home Improvement Customer [INFOGRAPHIC]
This infographic illustrates the online behavior of home improvement customers by generation.
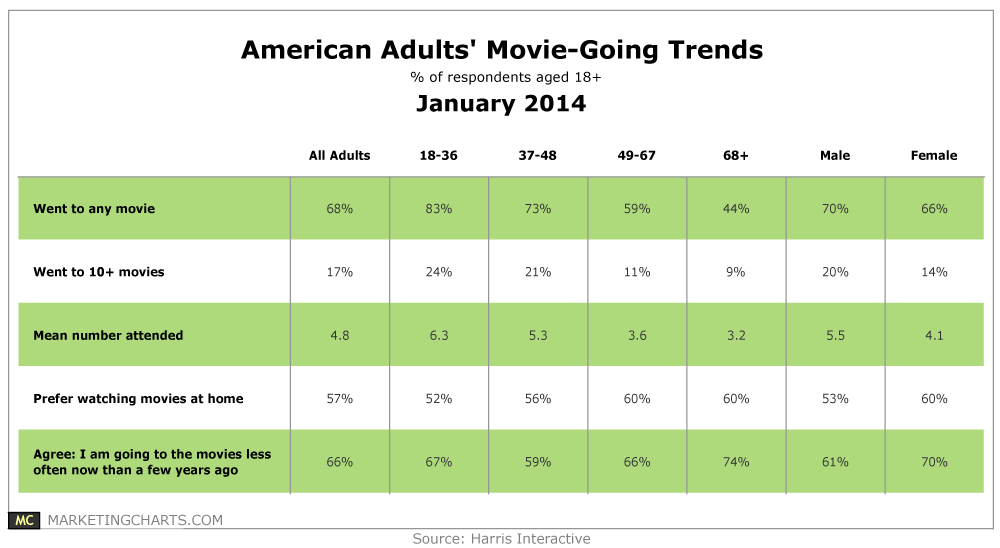
Read MoreAmericans' Movie-Going Frequency By Age, January 2014 [TABLE]
Americans went to about 5 movies on average last year.
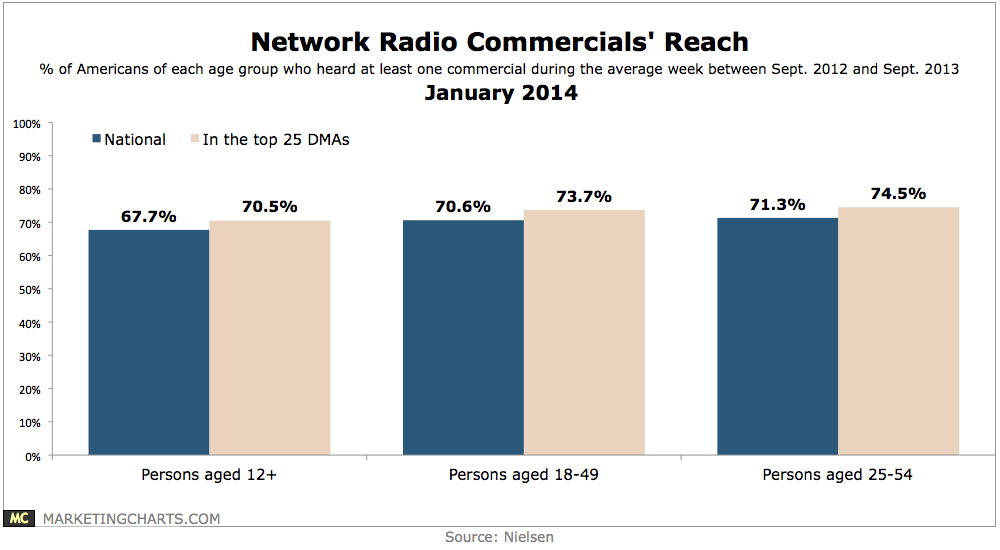
Read MoreNetwork Radio Commercials' Reach, January 2014 [CHART]
Radio reaches 91% of Americans aged 12 and older on an average weekly basis.
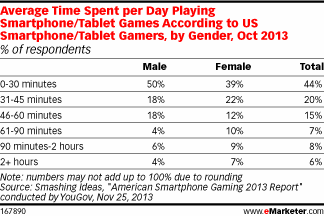
Read MoreAverage Daily Time Spent Playing Mobile Games By Gender, October 2013 [TABLE]
More than three-quarters of time US internet users spent with such content was on mobile, with desktop claiming just 22%.
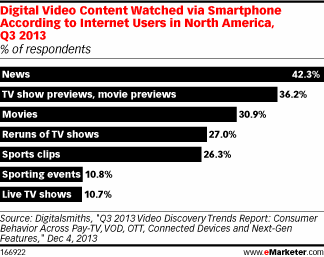
Read MoreTypes Of Video People Watch On Their Smart Phones, Q3 2013 [CHART]
Just over 42% of internet users in North America watched news video content on their smart phones.
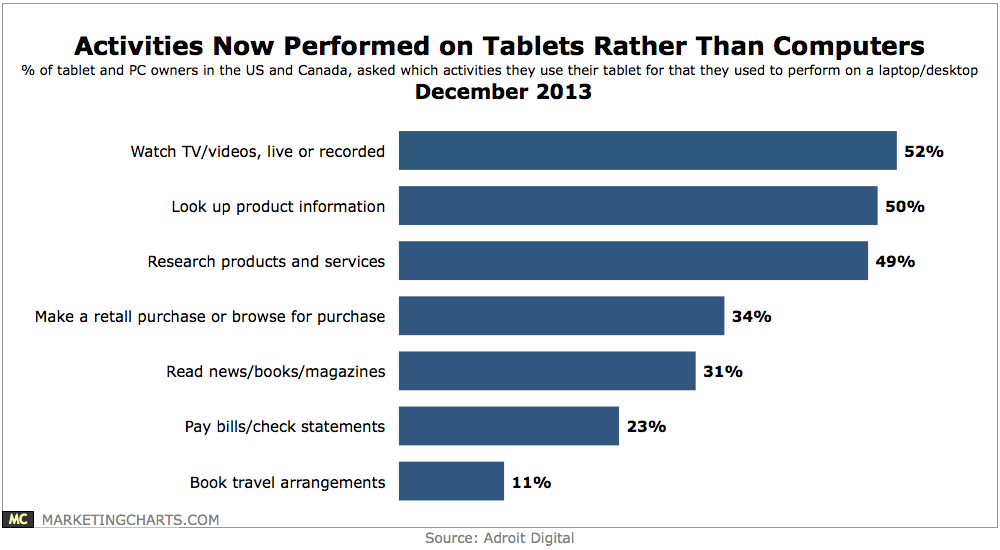
Read MoreComputer Activities Now Performed On Tablets, December 2013 [CHART]
55% of respondents who own both devices would consider purchasing a tablet as a replacement for their personal laptop or desktop.
Read More