Media Consumption
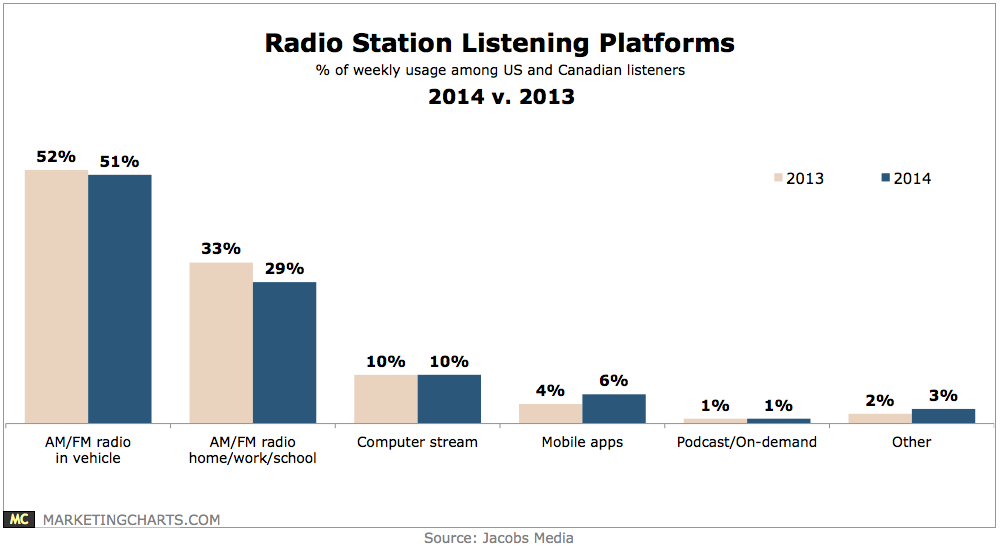
Radio Listening Platforms, 2013 vs 2014 [CHART]
Almost one-fifth of weekly radio usage in the US and Canada now occurs on digital sources.
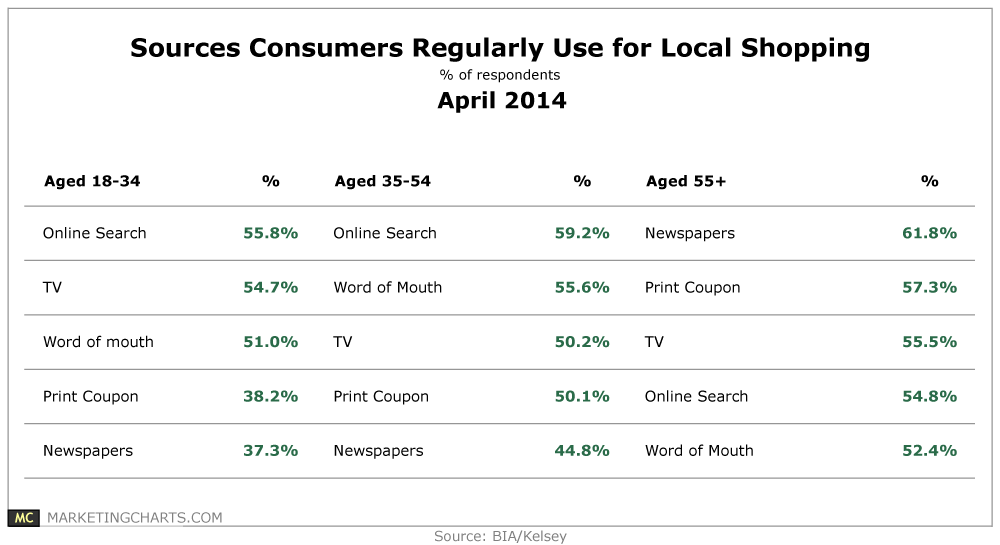
Read MoreSources Consumers Use For Local Shopping, April 2014 [TABLE]
The relative ranking of sources most regularly used by Millennials and Gen X are quite similar, while Baby Boomers still turn to print first.
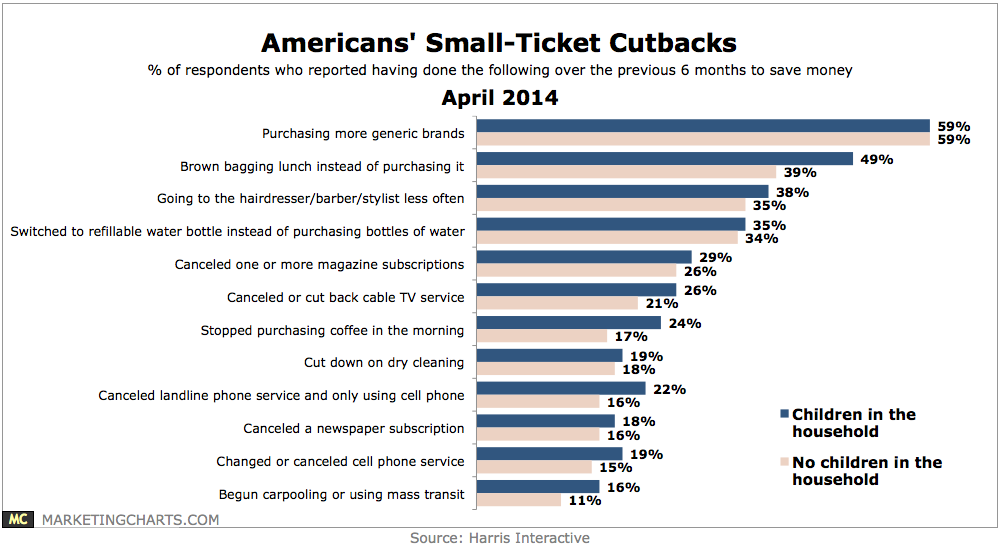
Read MoreAmericans' Small-Ticket Purchase Cutbacks, April 2014 [CHART]
Parents are also more likely than those without children in the household to decrease their spending in a variety of areas, including restaurants (64% vs. 56%) and entertainment (60% vs. 51%).
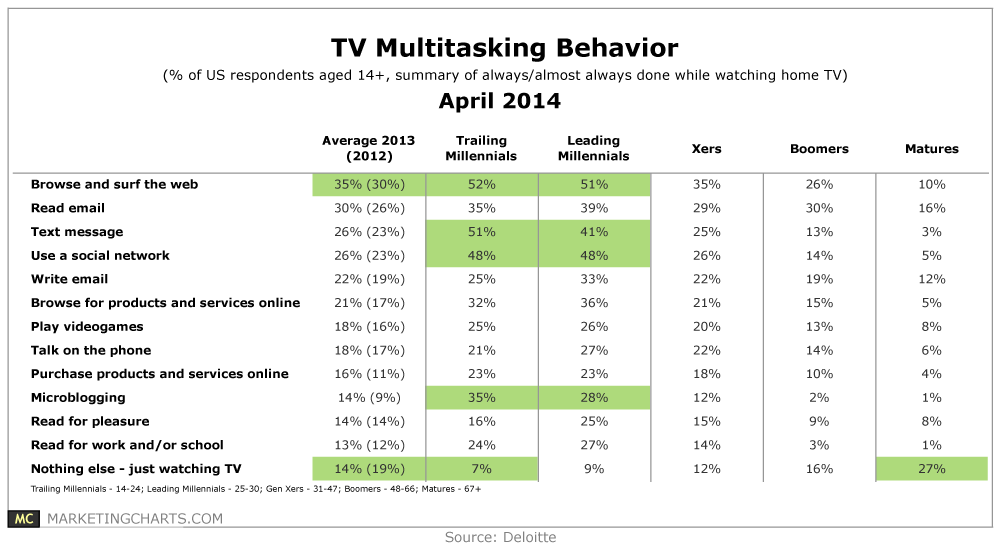
Read MoreMultitainment Behavior, April 2014 [TABLE]
Some 86% of US consumers (aged 14+) claim to always or almost always multitask while watching TV, up from 81% last year.
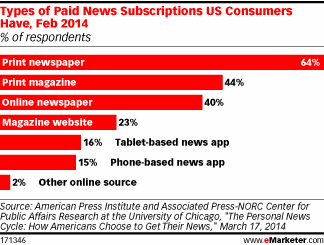
Read MoreAmericans' Paid News Subscriptions, February 2014 [CHART]
Just one-quarter of US consumers said that they currently paid for at least one news subscription.
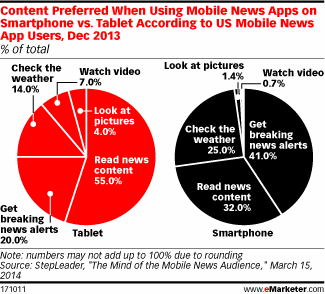
Read MorePreferred News App Content, Smart Phone vs Tablet, December 2013 [CHART]
Getting breaking news via smartphone apps was far more popular than on tablets, likely due to the former being more portable.
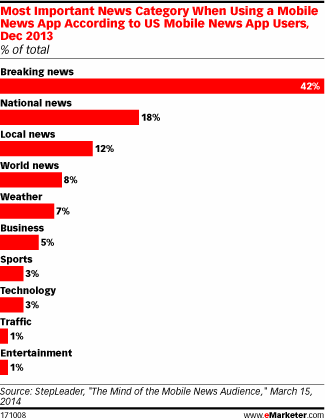
Read MoreMost Important News Category For Mobile News App Users, December 2013 [CHART]
42% of US mobile news app users said that breaking news was the most important news app category.
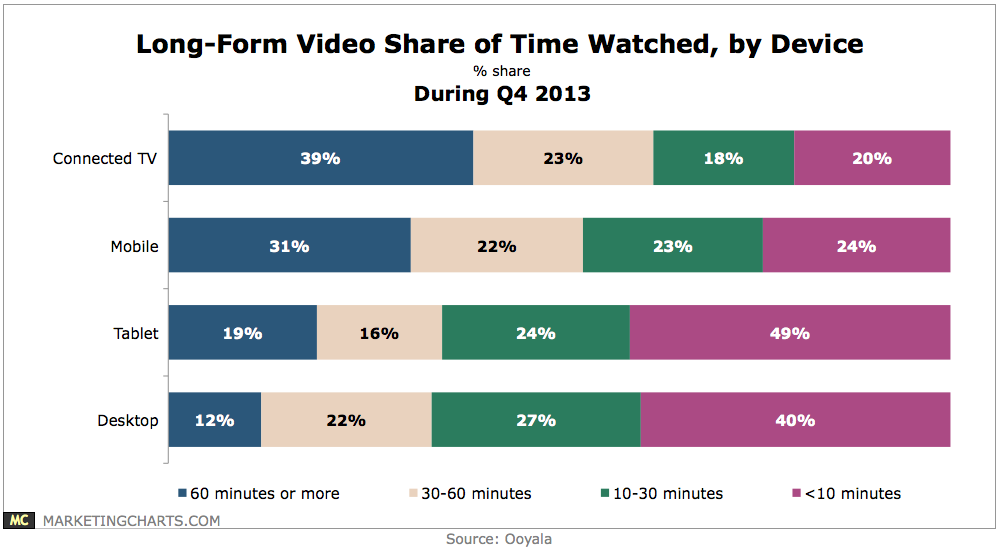
Read MoreLong-Form Video Share Of Time Watched By Device, Q4 2013 [CHART]
The majority of mobile video viewing time in Q4 2013 was spent with content at least a half-hour in length.
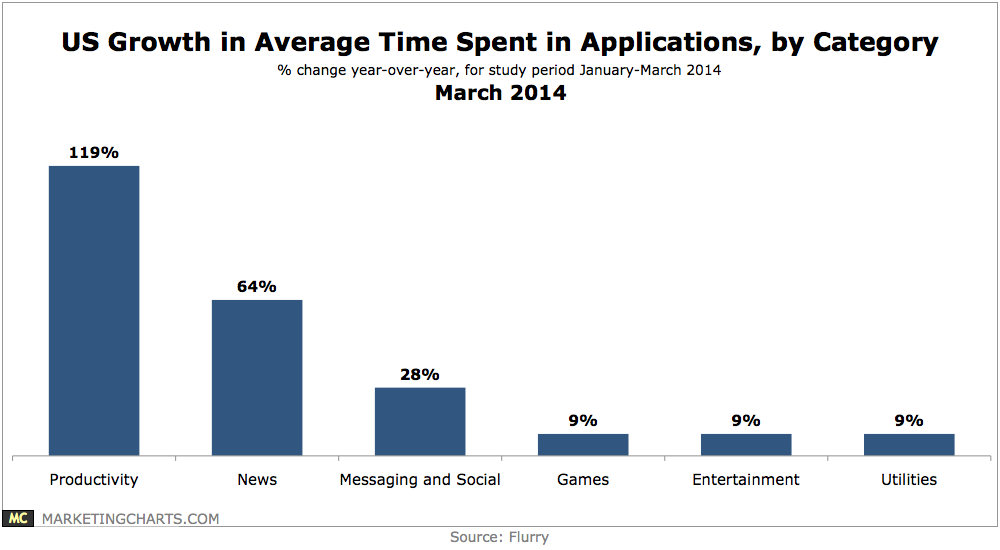
Read MoreGrowth In US Average Time Spent Using Apps By Category, March 2014 [CHART]
Average time spent in productivity apps is growing rapidly, but from a small base: the average US consumer spent 5 1/2 minutes per day in productivity apps during the Q1 study period.
Read MoreThe Plunging Value Of Television Advertising [CHART]
The number of households watching prime-time TV has clearly fallen, while ad rates per person have gone up.
Read More