Media Consumption
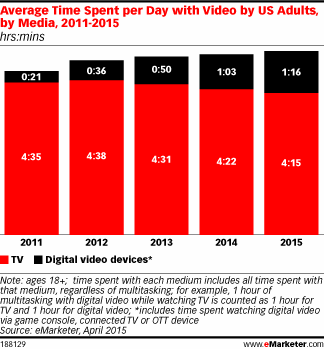
Daily Time Spent With Video By Device, 2011-2015 [CHART]
Adults in the US will spend an average of 5 hours, 31 minutes watching video each day this year.
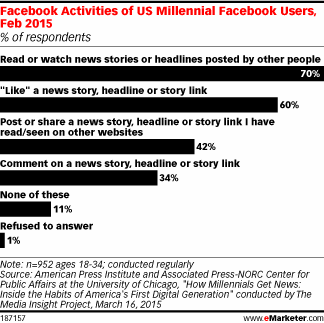
Read MoreHow Millennials Use Facebook For News, February 2015 [CHART]
Seven in 10 Millennials said they regularly read or watched news stories and headlines posted by other people on Facebook.
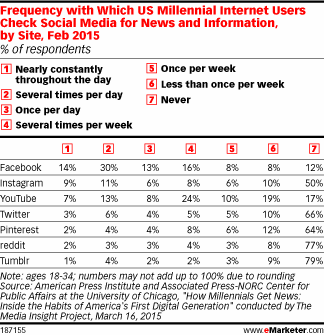
Read MoreFrequency With Which Millennials Check Social For News [TABLE]
57% of US millennials checked Facebook at least once a day to get news and information.
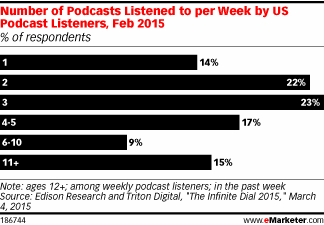
Read MoreNumber Of Podcasts People Listen To Weekly, February 2015 [CHART]
Weekly podcast listeners—estimated at approximately 27 million people—listened to an average of six podcasts per week.
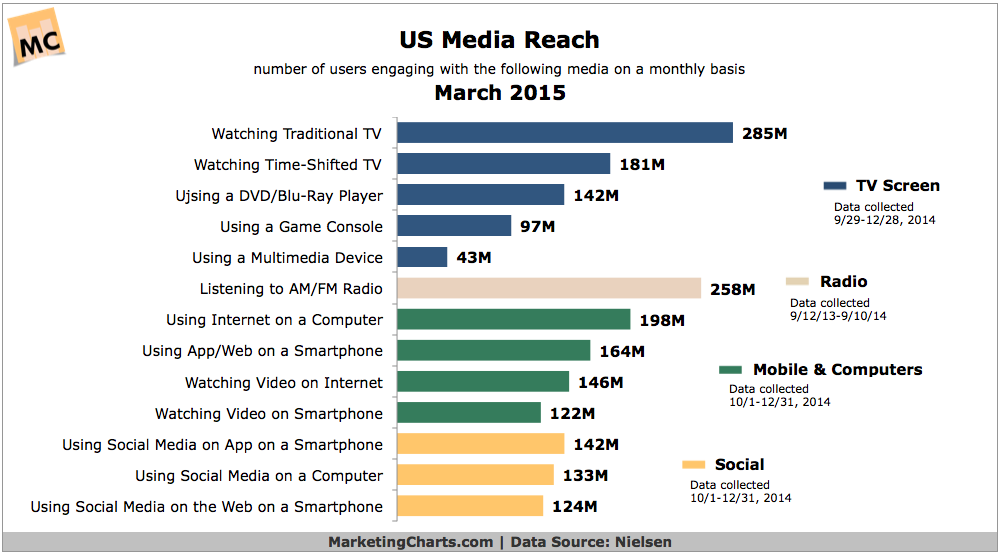
Read MoreUS Media Reach By Channel, March 2015 [CHART]
Some 142M Americans use social media applications on smartphones on a monthly basis, slightly higher than the number using social media on a computer 133 M.
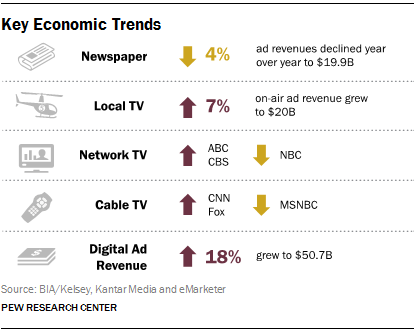
Read MoreNews Media Economics Trends [INFOGRAPHIC]
Newspaper ad revenue declined another 4% year over year, to $19.9 billion – less than half of what it was a decade ago.
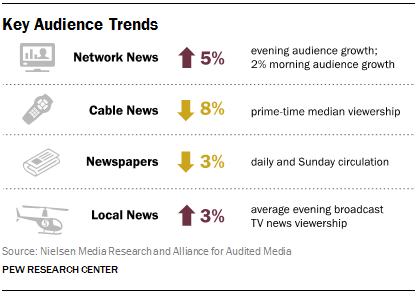
Read MoreTraditional News Consumption Trends [INFOGRAPHIC]
Even as mobile and social news habits evolve, legacy platforms have by no means been abandoned, though some are faring better than others.
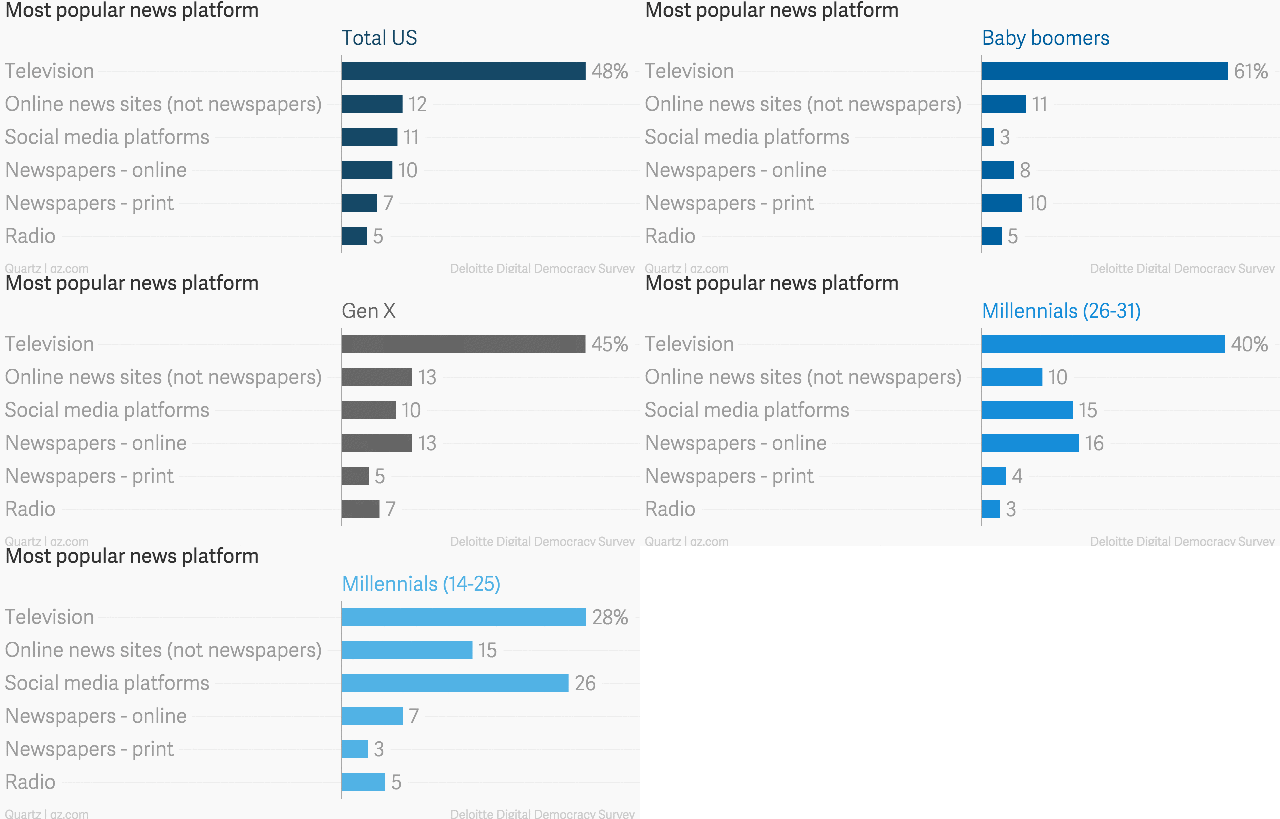
Read MoreMost Popular Sources Of News By Generation [CHART]
Most Popular Sources Of News: The younger you are, the more likely you’ll turn to social media for your news.
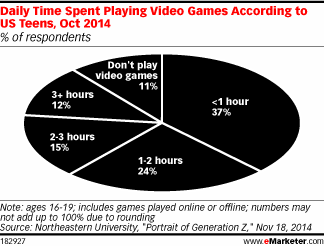
Read MoreTeens Daily Time Spent Playing Video Games, October 2014 [CHART]
Just 11% of US teens said the do not play video games.
Read MoreOnline Activities Conducted During Conference Calls, November 2014 [CHART]
Fully 80% admitted to multitasking during conference calls, with work emails the most popular digital activity.
Read More