Media Consumption
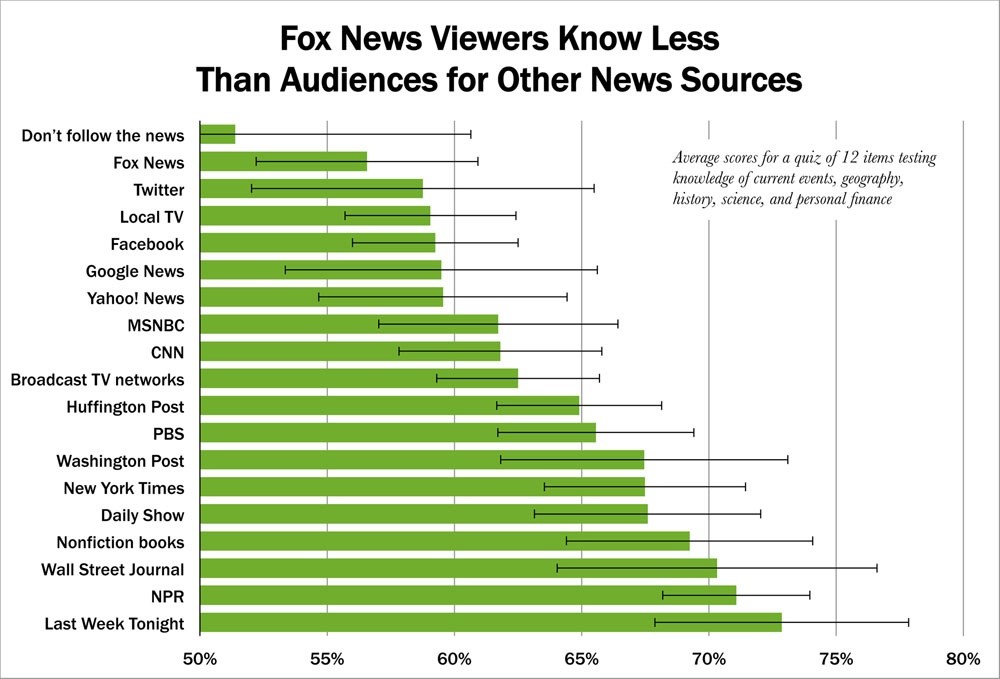
The Fox News Effect [CHART]
Fox News viewers scored the lowest of over 30 popular news sources (though Fox viewers did at least score better than those saying they didn’t follow the news).
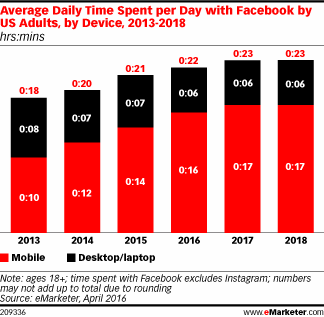
Read MoreDaily Time Spent On Facebook By Device, 2013-2018 [CHART]
This year, Americans will spend more than half of their social networking time on Facebook.
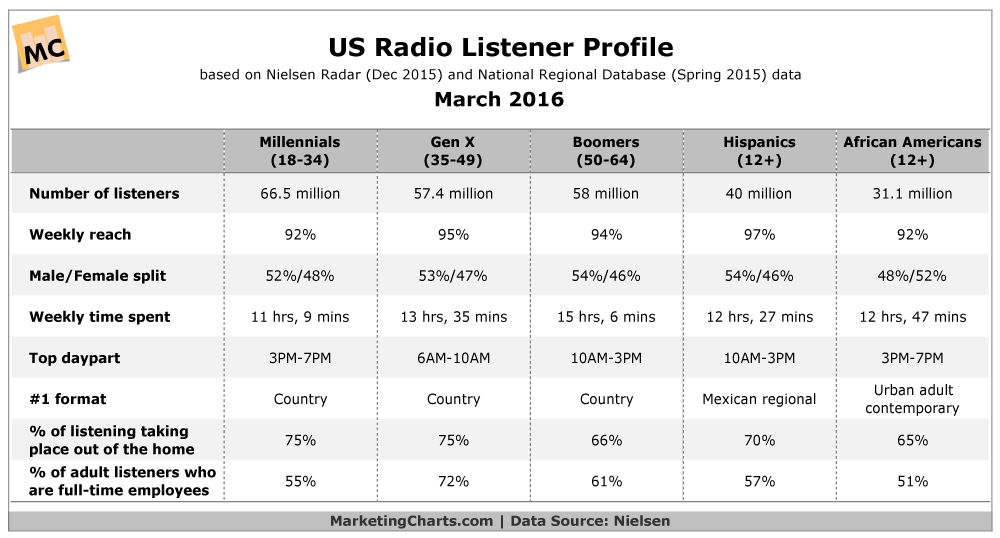
Read MoreRadio Listeners' Habits By Generation & Ethnicity [CHART]
With 93% of US adults listening to radio on a weekly basis, radio is the leading reach platform.
Read MoreVideo Marketing Statistics [INFOGRAPHIC]
Including a video in an email increases the click-through rate by 200-300 percent. This statistic and 30 more are included in this infographic from Hyperfine Media that illustrates the many ways video can be used for marketing.
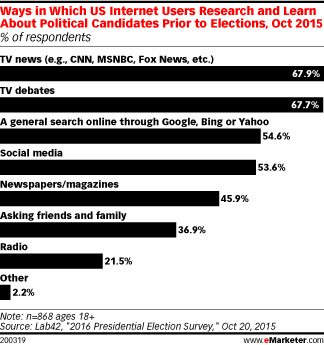
Read MoreHow People Research Political Candidates [CHART]
TV news and TV debates are still the primary ways in which US internet users research and learn about political candidates prior to elections.
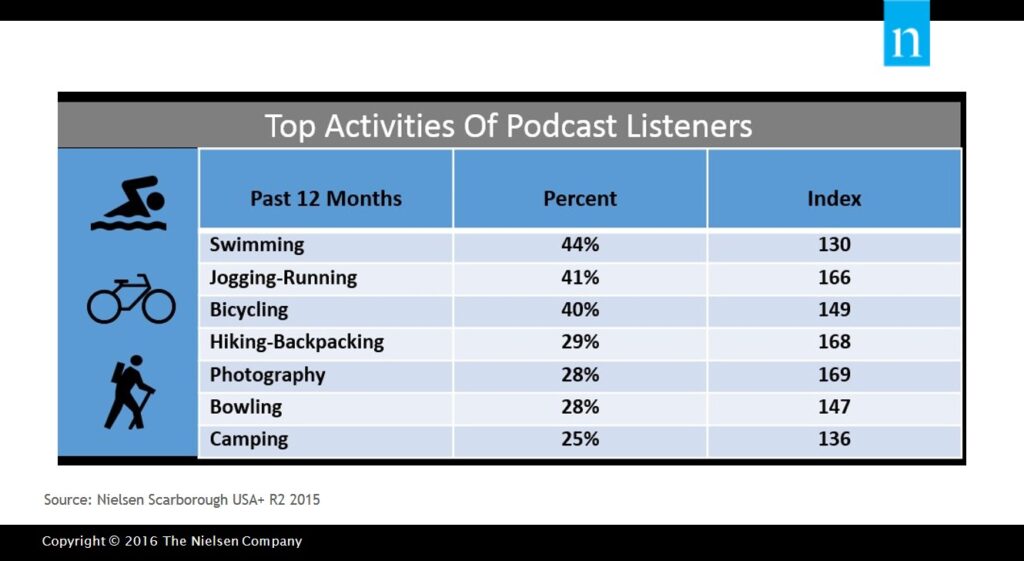
Read MoreTop Activities Of Podcast Listeners [TABLE]
Podcast listeners are adventurous, and they love the great outdoors. Hiking-, backpacking- and camping-related content will grab their attention.
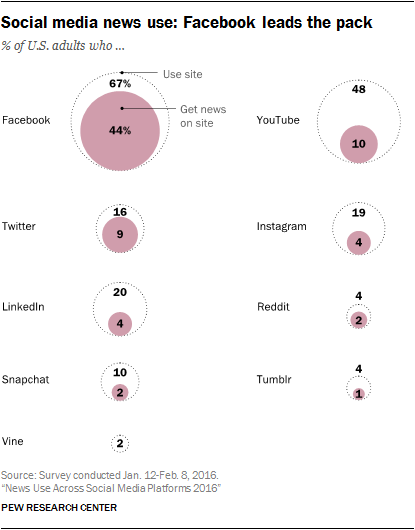
Read MoreSocial Media Sites Where Americans Get News [INFOGRAPHIC]
As part of an ongoing examination of social media and news, Pew Research Center analyzed the scope and characteristics of social media news consumers across nine social networking sites.
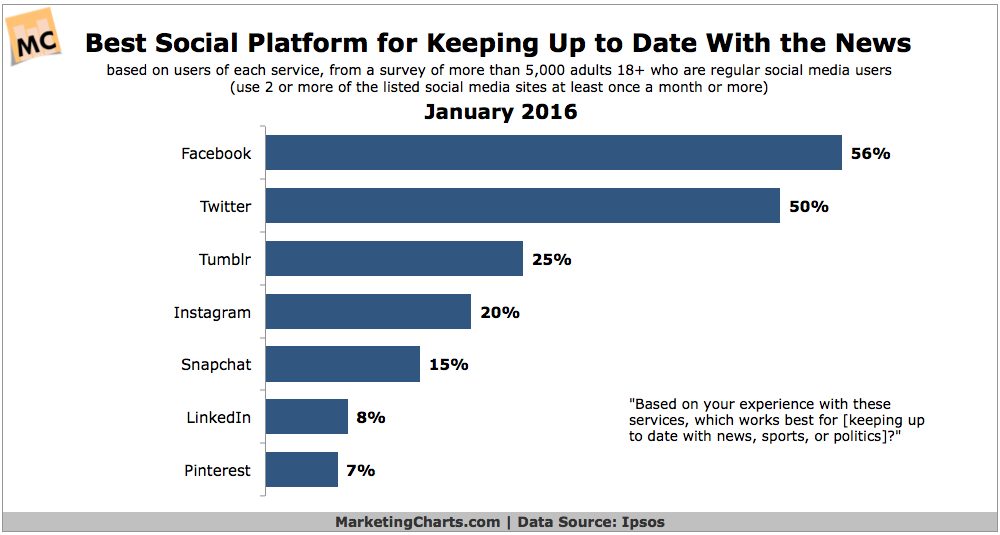
Read MoreTop Social Sites For News Consumption [CHART]
Facebook narrowly edges Twitter as the social platform that users believe is best for keeping up to date with news, sports or politics.
Read MoreAmericans' Weekly Media Consumption By Race/Ethnicity [TABLE]
Americans’ Weekly Media Consumption By Race/Ethnicity [TABLE]Black adults watch almost three times more TV on a weekly basis than Asian-American adults.
Read MoreUS Mothers' Media Consumption, 2010-2015 [CHART]
More than nine in 10 mothers with children under 18 in the household are internet users.
Read More