Media Consumption
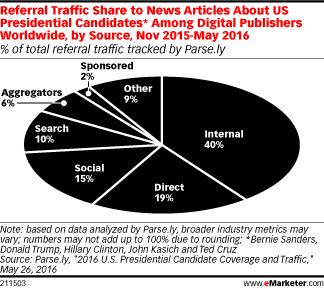
How People Find News About Presidential Candidates [CHART]
Much of the referral traffic to news articles about US presidential candidates is internal.
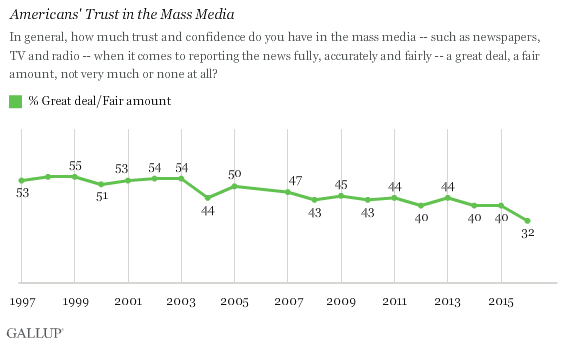
Read MoreAmerican's Trust In Mass Media [CHART]
Americans’ trust and confidence in the mass media ‘to report the news fully, accurately and fairly’ has dropped to its lowest level in Gallup polling history.
Read MorePodcast Listening Frequency [CHART]
Most internet users are familiar with podcasts, but have either not listened to them within the past six months or have never listened to them.
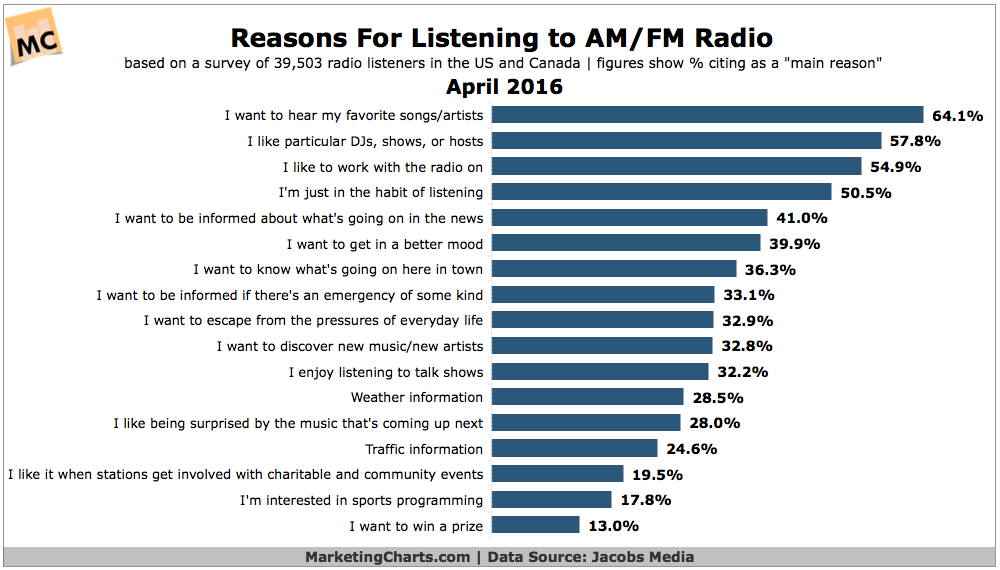
Read MoreWhy People Listen To Radio [CHART]
Almost 1 in 5 AM/FM radio listeners report spending more time listening to the radio this year than last, close to twice the proportion of listeners who are tuning in less.
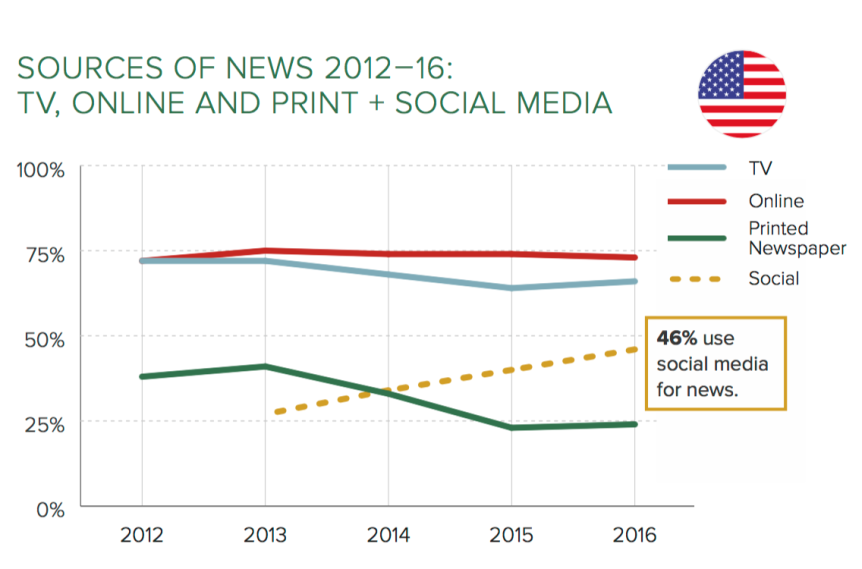
Read MoreSources Of News, 2012-2016 [CHART]
Since 2013, the number of people in the US who say they get their news from social media has doubled—46 percent now use social media for news.
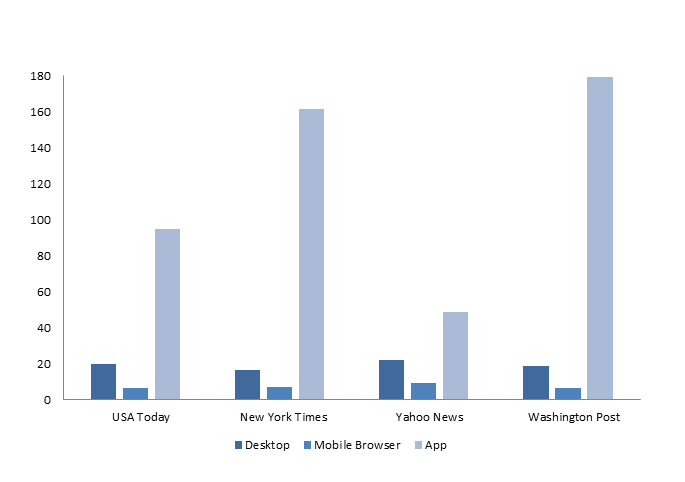
Read MoreAverage Minutes Visitors Spent On News Sites, Mobile vs Desktop [CHART]
By 2020, two-thirds of all online activity is expected to take place on mobile devices.
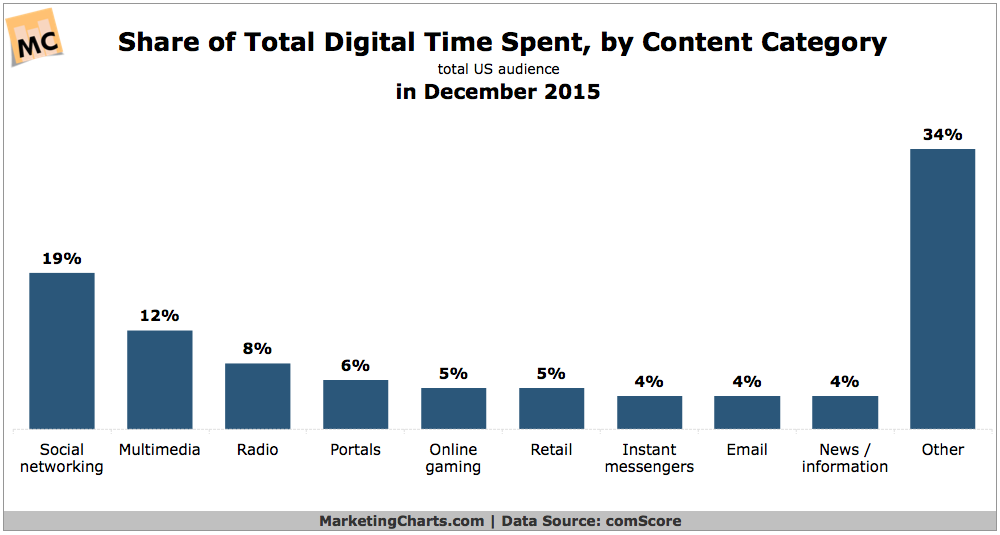
Read MoreTime Spent Online By Content Type Or Channel [CHART]
Social networking accounts for almost 1 in every 5 minutes spent online, according to a recent study from comScore.
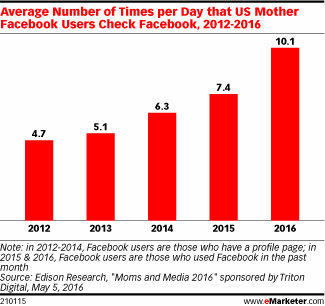
Read MoreUS Mothers' Average Daily Facebook Use, 2012-2016 [CHART]
US mothers are checking Facebook more times each day than they did in prior years.
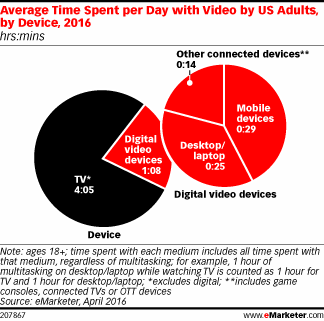
Read MoreAverage Daily Video Consumption By Device [CHART]
Even in a category as robust as digital video, though, growth has slowed and is expected to slow even more.
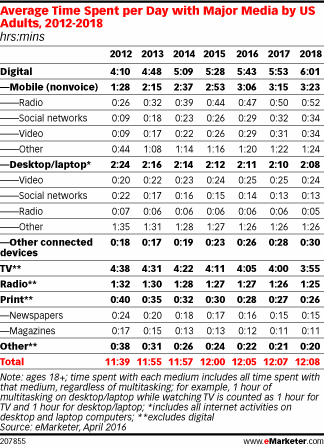
Read MoreAverage Daily Time Spent With Media, 2012-2018 [TABLE]
Thanks to media multitasking, US adults will squeeze an average of 12 hours, 5 minutes per day of media usage into their waking hours this year—nearly an hour more than the average in 2011.
Read More