Media Consumption
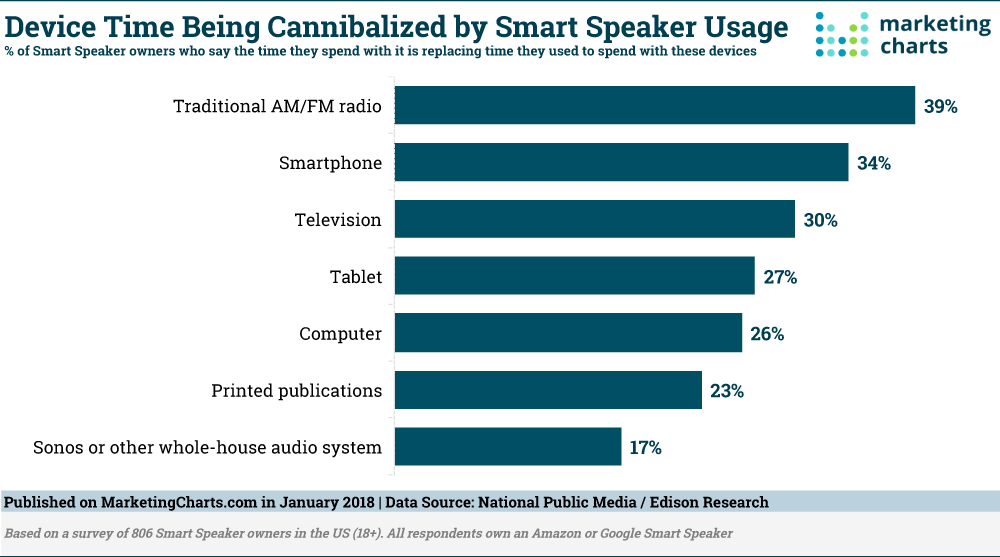
Media Consumption Displaced By Smart Speakers [CHART]
Let’s not call it the year of voice, even if it proves to be… Nonetheless there has been a rash of new research released surrounding voice assistants – and Smart Speakers in particular.
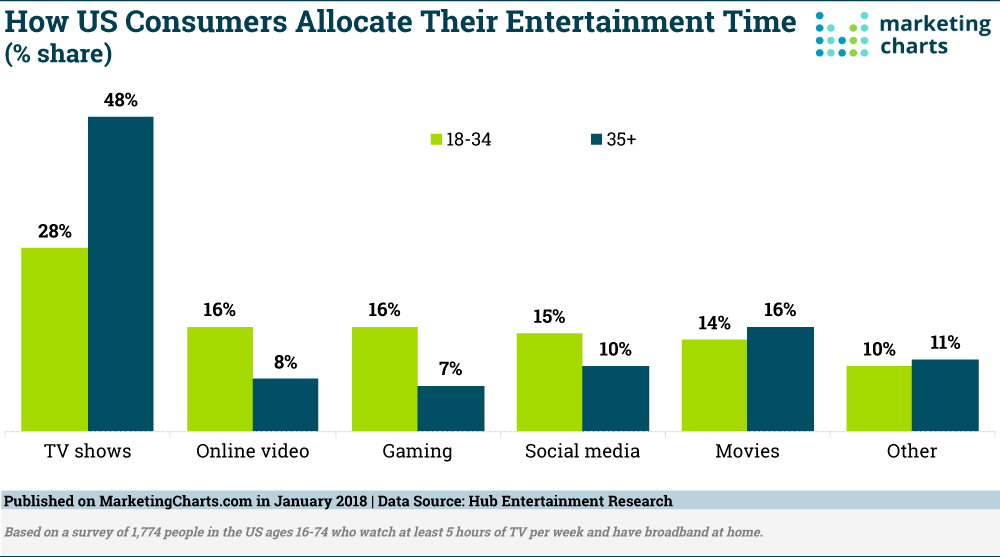
Read MoreEntertainment Media Consumption By Channel [CHART]
The differences between 18-34-year-olds and those 35 and older were predictable, but nonetheless stark. It’s clear that watching TV shows is a far more popular pastime for adults 35 and up than for their younger counterparts.
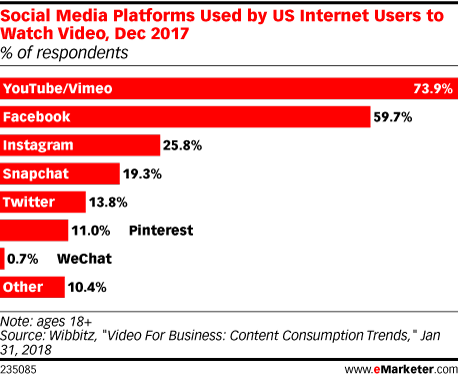
Read MoreTop Social Video Platforms [VIDEO]
New research from artificial intelligence-powered video creation service Wibbitz provides some insight into which social media platforms video advertisers should be paying attention to—and it’s pretty much what you would expect.
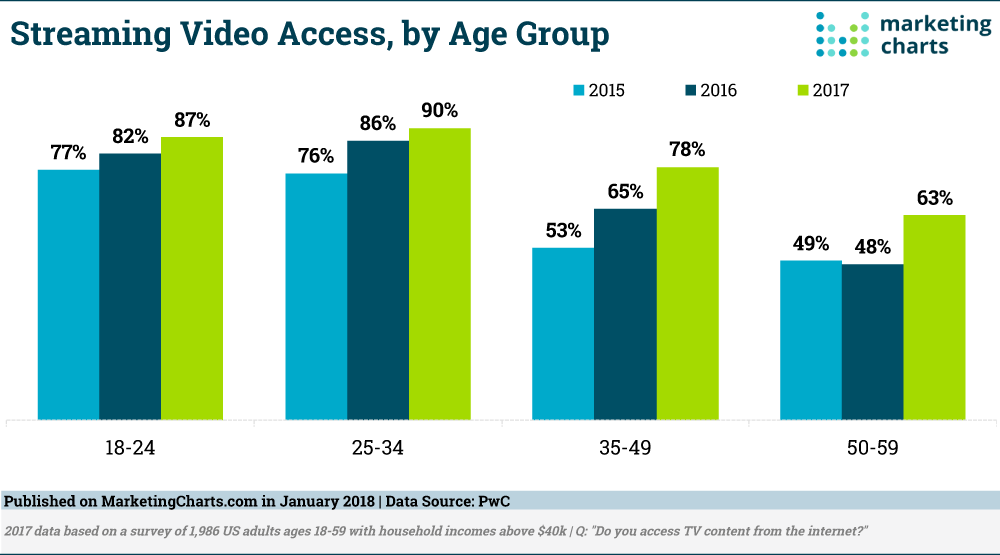
Read MoreStreaming Video By Age Group, 2015-2017 [CHART]
Streaming video has been popular with Millennials for some time, but it’s middle-aged Americans who are now getting in on the act. Almost 8 in 10 adults ages 35-49 accessed TV content from the internet in 2017, up from 53% just a couple of years earlier.
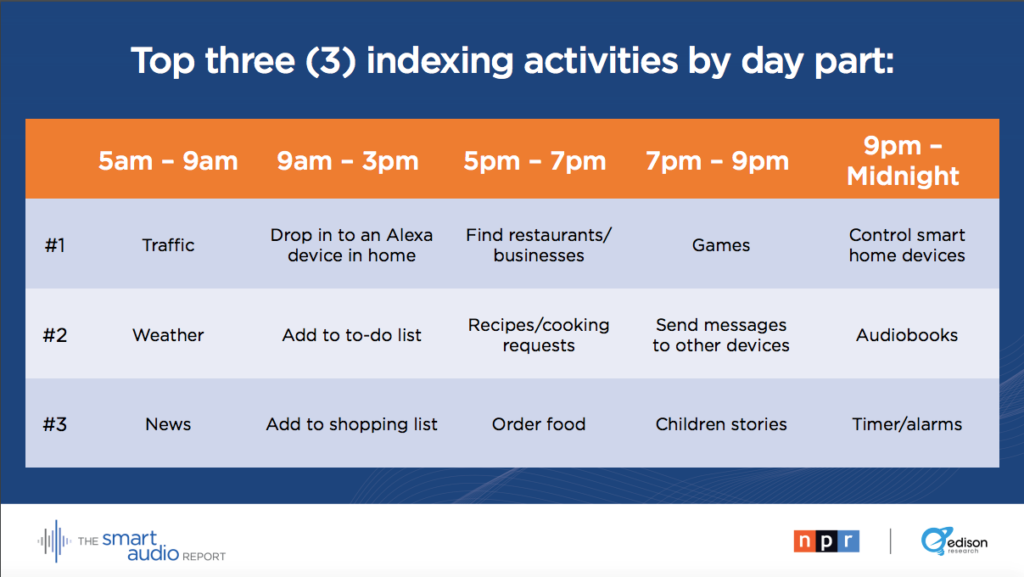
Read MoreVoice Assistant Use By Daypart [TABLE]
After a surge this past holiday season – when 4% of U.S. adults reported they acquired their first smart speaker device — ownership is up 128% since January 2017, to now one in six Americans (16%) having a smart speaker.
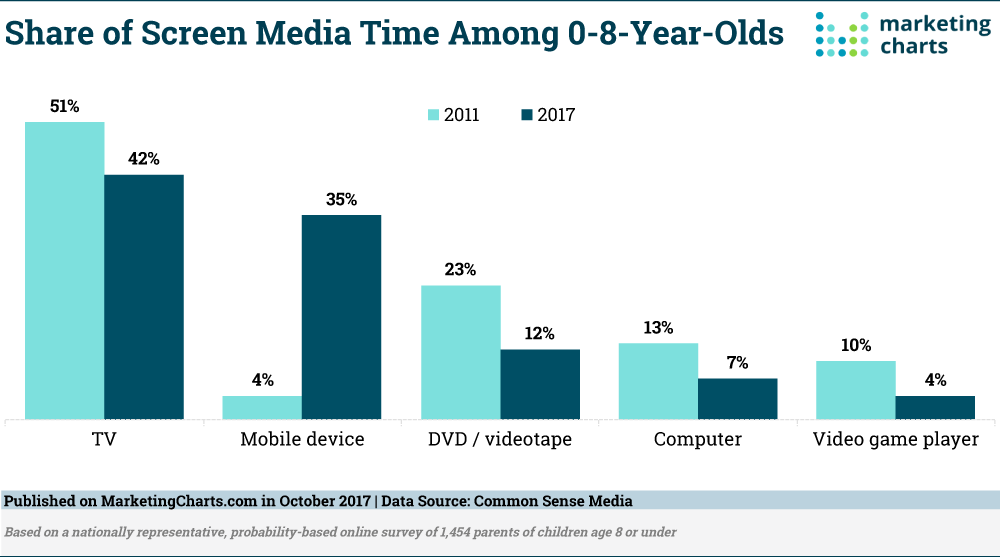
Read MoreShare Of Screen Time For Generation V [CHART]
Virtually all children ages 0-8 live in households that have a mobile device, and that is clearly having an effect on media use, per results from a Common Sense Media study. The research details a striking shift in screen use over the past few years: children now spend 35% of their screen time with mobile devices, up from just 4% in 2011.
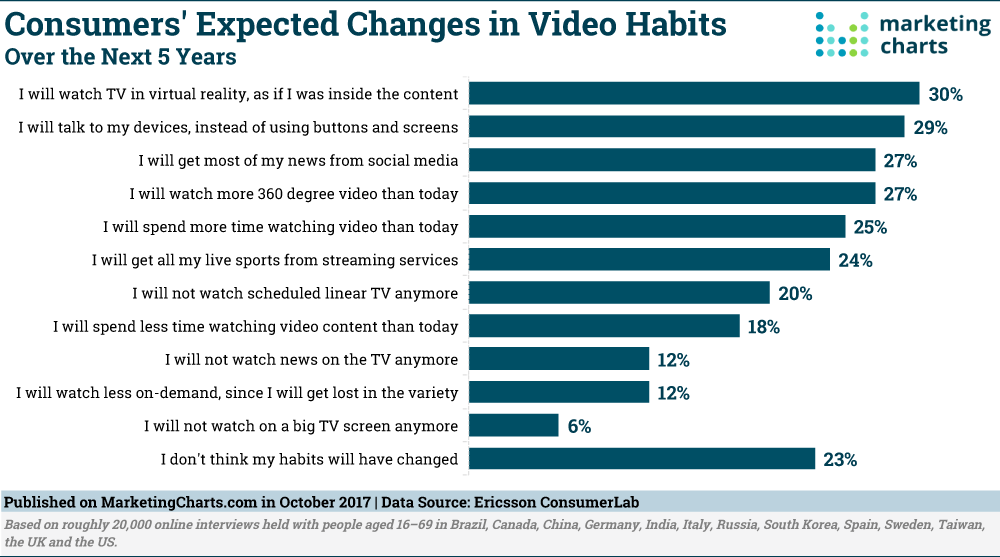
Read MoreConsumers' Expected Video Consumption Changes [CHART]
More than three-quarters of people in several countries across the world believe that their video viewing habits will change in the coming 5 years. The change that most people see coming is watching TV in virtual reality, as if they are inside the content.
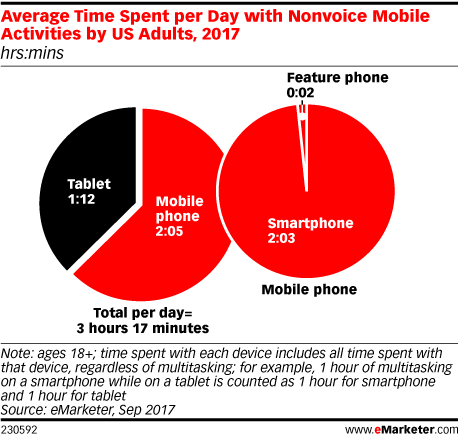
Read MoreAverage Daily Time Spent On Nonvoice Mobile Activities, 2017 [CHART]
Among the media categories for which eMarketer gauges time spent, there aren’t any anticipated to see double-digit increases or decreases next year. (Mobile video comes closest, with an 8.7% rise expected.) Overall, time spent with digital media is expected to grow a modest 3.5%.
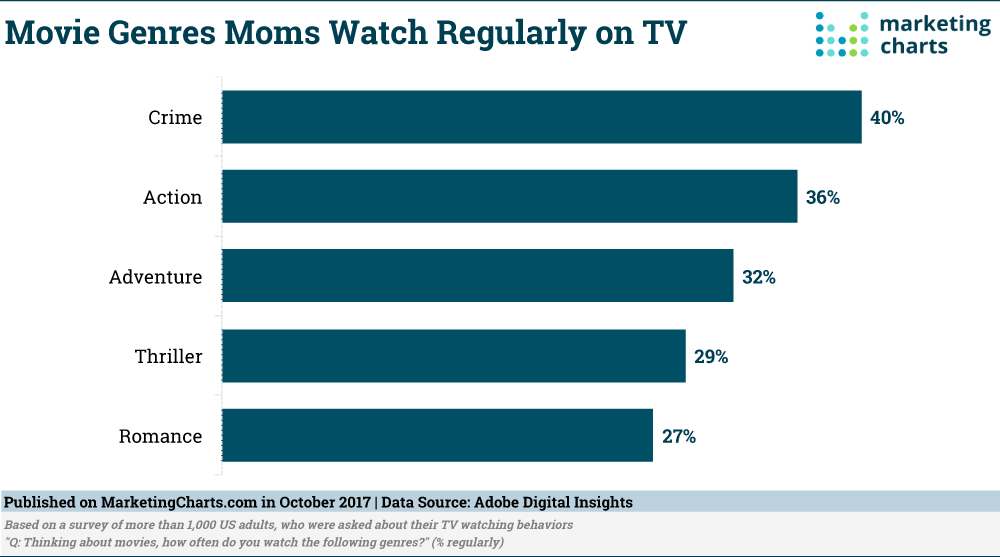
Read MoreMoms' Most-Watched Movie Genres On TV [CHART]
Moms love action and men watch romance. Surprised? A study from Adobe Digital Insights finds that some stale stereotypes simply don’t apply. Mothers watch Crime and Action movies more regularly than Romances, while many men often watch Musicals and Romance movies.
Read MoreData Generated Per Minute By Platform [INFOGRAPHIC]
This infographic illustrates just how much data media platforms ranging from Twitter and YouTube to Netflix and Spotify generate by the minute.
Read More