Marketing Budgets
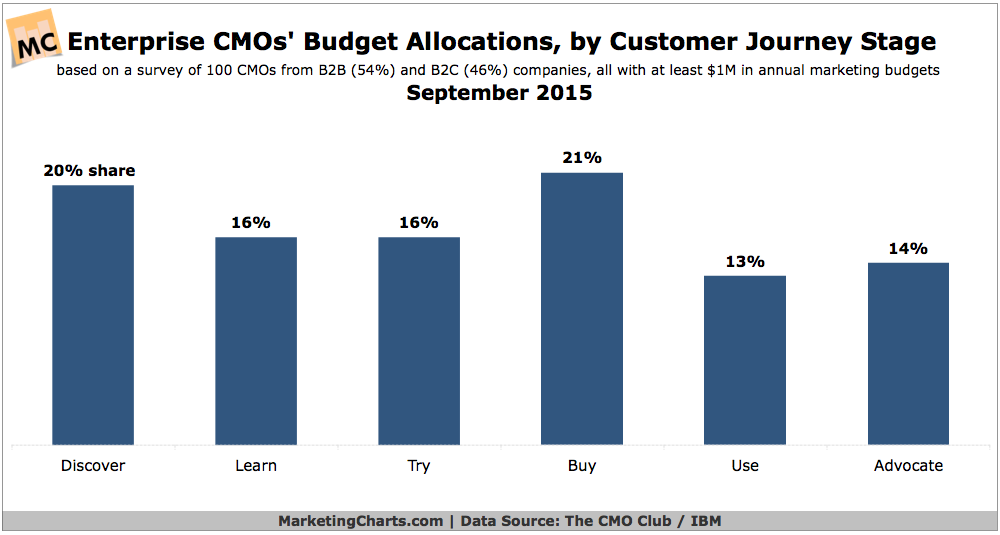
Budget Allocations By Customer Journey Stage, September 2015 [CHART]
CMOs are no longer investing the majority of their budgets to customer acquisition, instead spreading their spending more evenly across the customer journey.
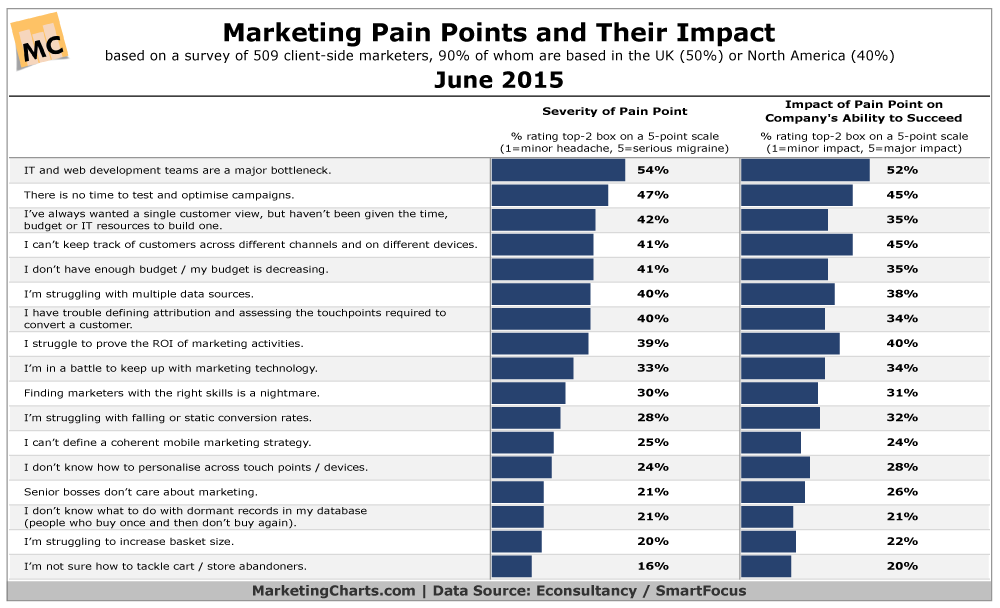
Read MoreMarketers' Top Pain Points, June 2015 [CHART]
The biggest pain point for client-side marketers today is the major bottleneck presented by IT and web development teams.
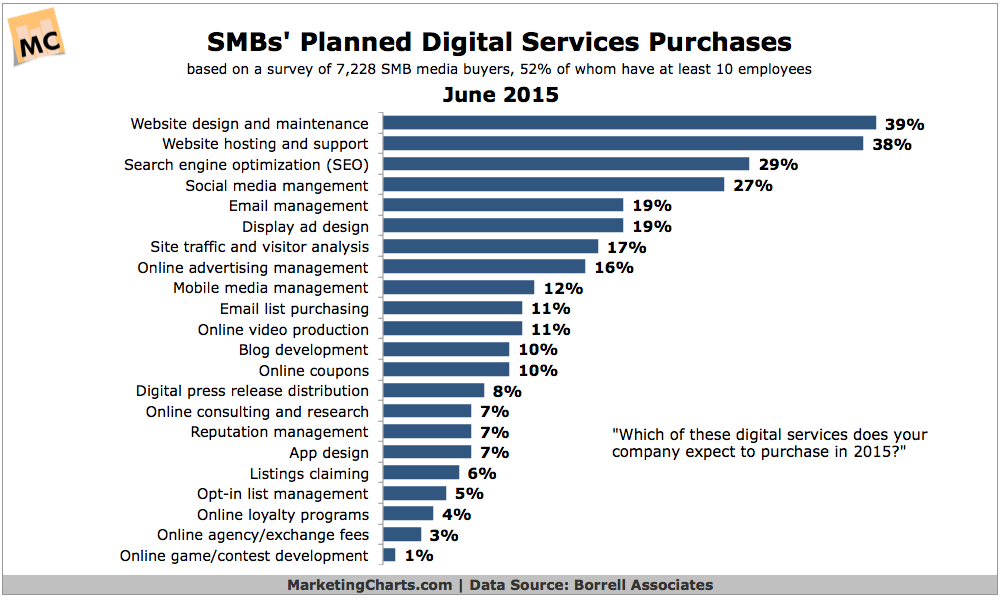
Read MoreSMBs’ Planned Online Marketing Services Purchases, June 2015 [CHART]
More than 7 in 10 US SMBs are buying some type of digital services today.
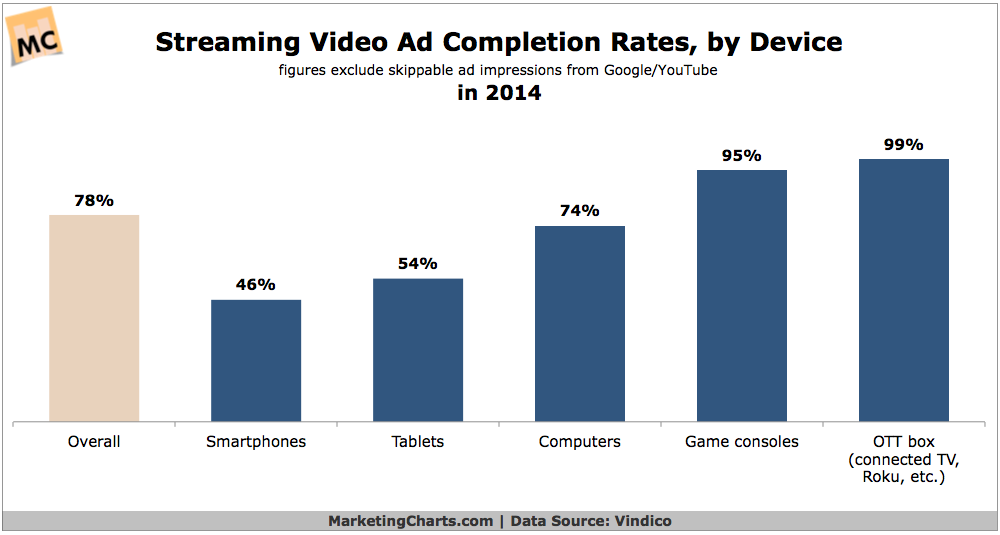
Read MoreStreaming Video Ad Completion Rates By Device Type, 2014 [CHART]
Streaming video ad completion rates were lower on devices with smaller screens last year.
Read MoreGlobal Wearable Shipments, 2014-2020 [TABLE]
Estimates for 2014 wearables shipments made by multiple firms showed a gap of 10 million units between the most conservative and most aggressive projections.
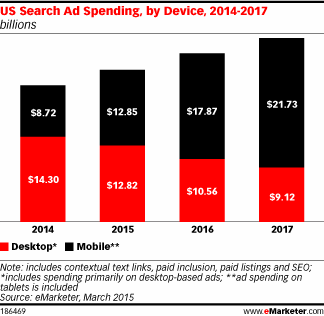
Read MoreUS Search Ad Spending By Device, 2014-2017 [CHART]
eMarketer expects mobile to overtake desktop for US search ad dollars this year, rising from $8.72 billion to $12.85 billion.
Read MoreState Of The Internet, 2015 [MARY MEEKER PRESENTATION]
Mary Meeker’s annual State of the Internet report was released today and, as usual, it is jam-packed with fascinating and useful stats on how we use online communications.
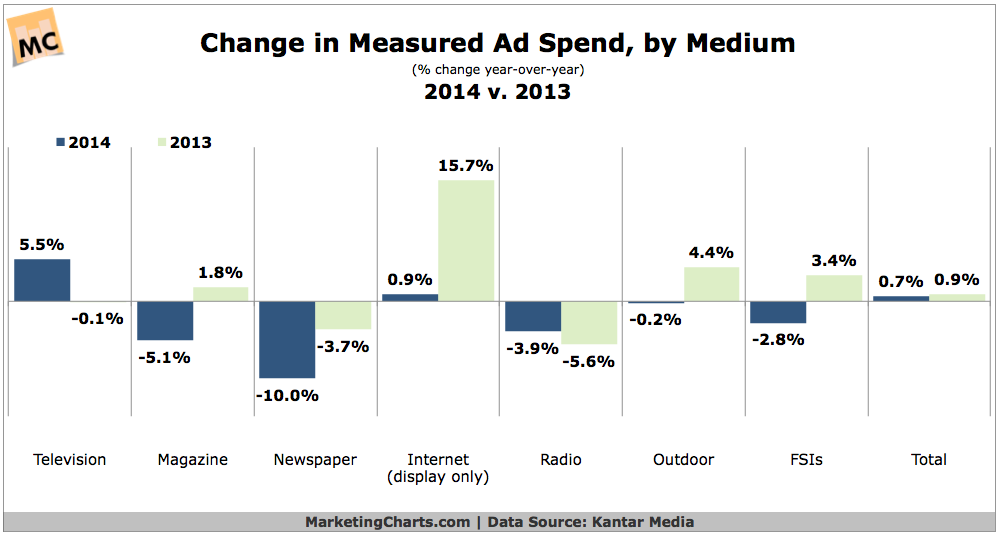
Read MoreChange In Ad Spending By Medium, 2013 vs 2014 [CHART]
After growing by 0.9% in 2013, US advertising expenditures maintained a similar rate of growth of 0.7% in 2014 to reach $141.2 billion.
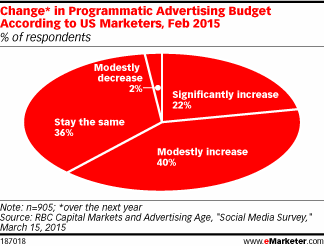
Read MoreChange In Programmatic Ad Budget, February 2015 [CHART]
Following triple-digit gains in 2013 & 2014, programmatic ad spending will continue on a solid growth trajectory in 2015, rising nearly 50% to $14 billion.
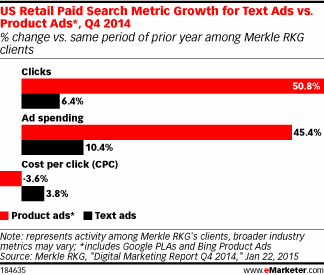
Read MoreUS Retailers Paid Search Metric Growth For Text vs Product Ads, Q4 2014 [CHART]
US retail paid search clicks for Product Listing Ads and Bing Product Ads combined rose 50.8% year over year in Q4 2014, vs. 6.4% for text ads.
Read More