Marketing Budgets
US Digital Ad Spending By Channel, 2011-2017 [CHART]
Desktop ad spending will peak in 2014 at $35.39 billion, up from this year’s projected total of $34.29 billion.
Read MoreUS Online Ad Spending Growth By Industry, 2011-2017 [TABLE]
Four of the six industries growing their digital ad spending at or above overall market rates are retail, financial services, consumer packaged goods & travel.
Read MoreDigital & Offline Marketing Budget Allocations By Objective, March 2013 [CHART]
Marketers allocated 60% of their offline budget to branding vs. 42% of their digital budget.
Read MoreChanges In Digital Marketing Spending By Category, March 2013 [CHART]
Marketers seem to have no hesitations about social, as 55% of respondents said they were putting more dollars to the format, while no advertisers reported decreasing social investments.
Read MoreGlobal Marketing Budgets, October 2011-May 2013 [CHART]
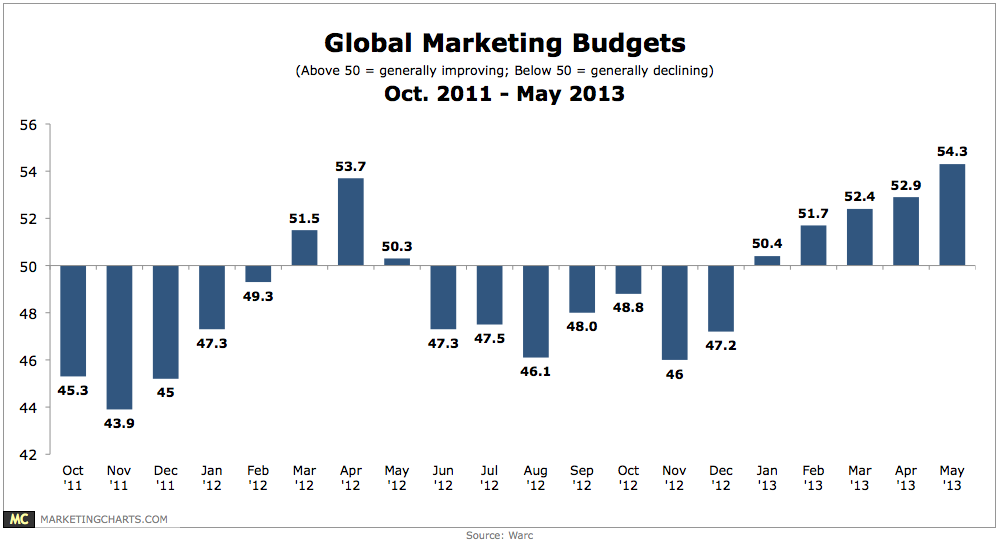
Marketing budget conditions have improved for the 5th consecutive month.
Read MoreMarketers' Social Media Plans, May 2013 [CHART]
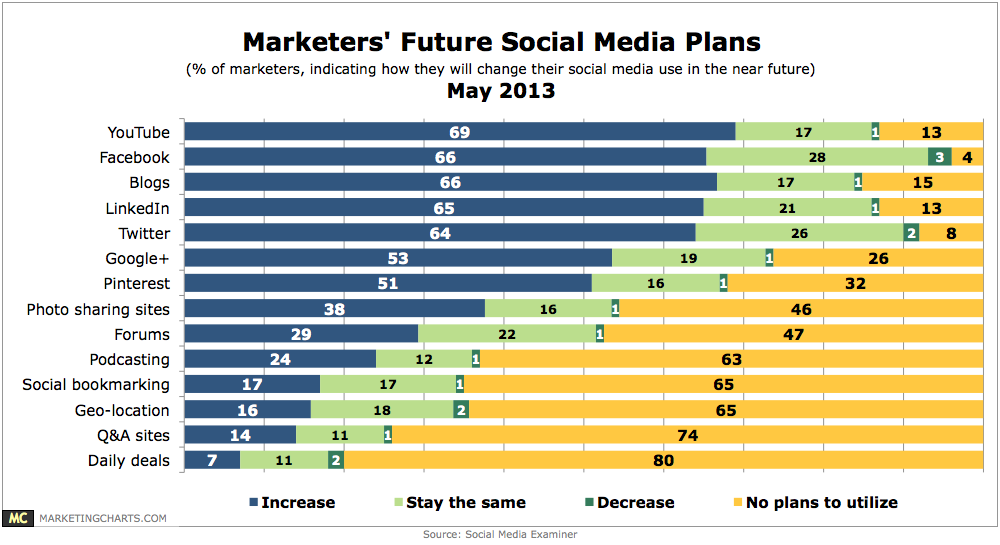
This year, 69% of marketers plan to increase their YouTube marketing efforts in the near future, while another 17% plan to maintain current levels, and just 13% don’t have any plans to utilize the platform.
Read MoreData-Driven Marketing Spending, Q1 2013 [CHART]
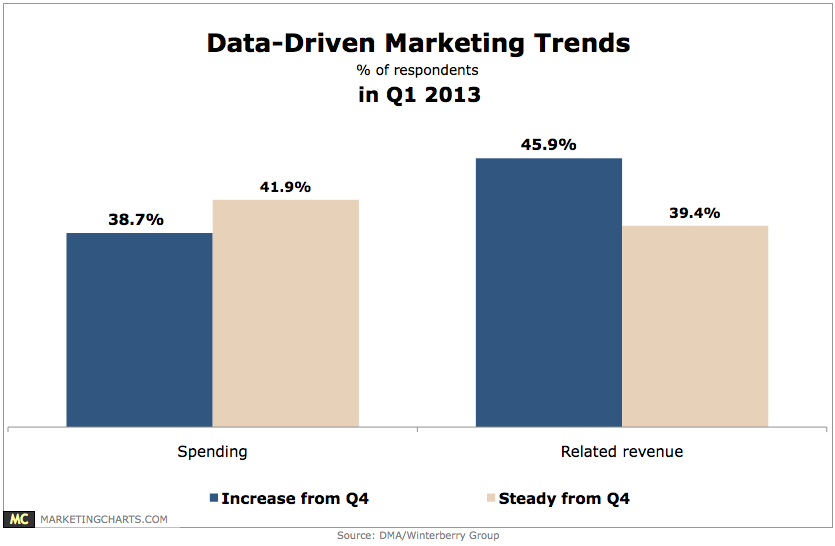
38.7% indicated that their data-driven marketing spending increased quarter-over-quarter, with another 41.9% reporting a steady level of spending.
Read MoreUK Marketers & Digital Media Spending, May 2013 [TABLE]
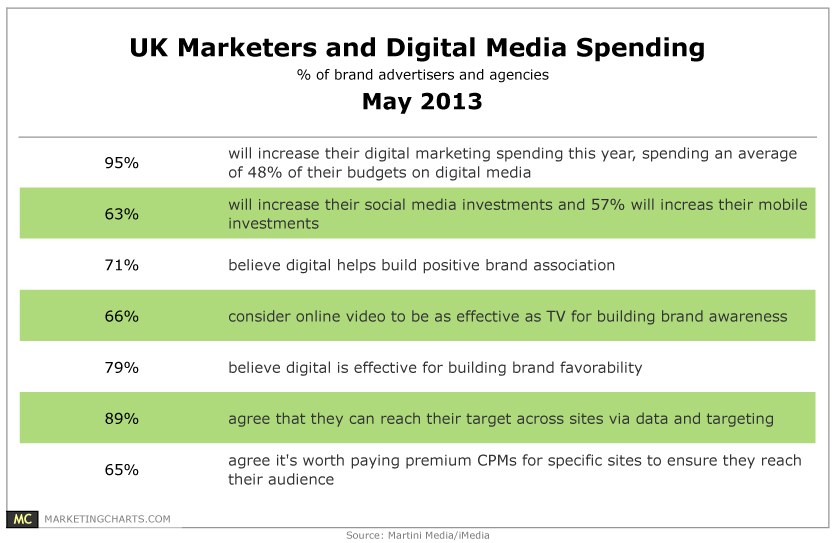
95% of brand advertisers and agencies responding to the survey said they will increase their digital marketing spending this year, with fully 48% of total budgets going to digital media.
Read MoreAmerican Mobile Marketing Spending, 2010-2015 [CHART]
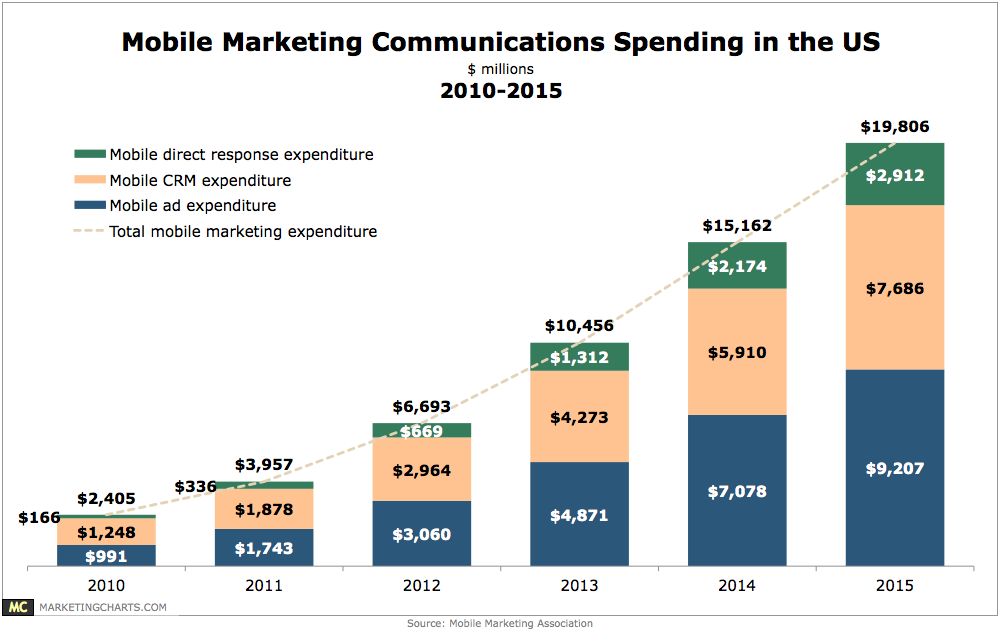
The mobile marketing ecosystem is demonstrating rapid growth, with $6.7 billion spent by client-side marketers and retailers in 2012.
Read More