Marketing Budgets
Global Mobile Ad Spending By Region, 2011-2017 [TABLE]

Mobile spending will hit nearly $15.82 billion, representing a whopping 79.7% year-over-year increase.
Read MoreGlobal Ad Spending By Region, 2011-2017 [TABLE]

Global ad spending will rise 2.8% to more than half a trillion dollars in 2013.
Read MoreChange In B2B Marketing Spending For 2014 [CHART]
45% of marketers expected to see an increase in budgets in the next year, while 52% thought their outlays would remain the same.
Read MoreNative Advertising & Content Creation Spending Plans, September 2013 [CHART]
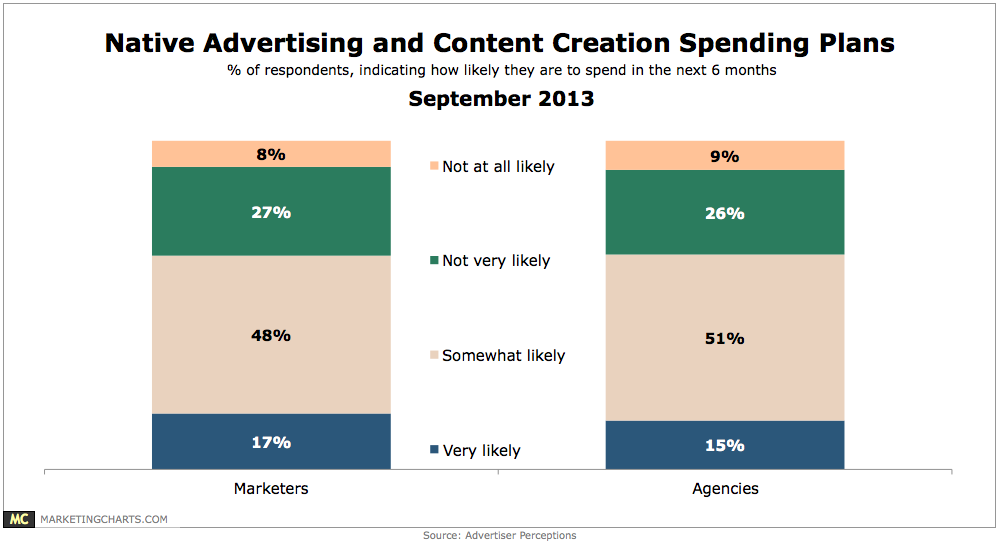
Roughly 2 in 3 marketers and agencies surveyed indicated that they are somewhat or very likely to spend on native ads and content creation in the next 6 months.
Read MoreGlobal Marketing Budgets, October 2011 – September 2013 [CHART]
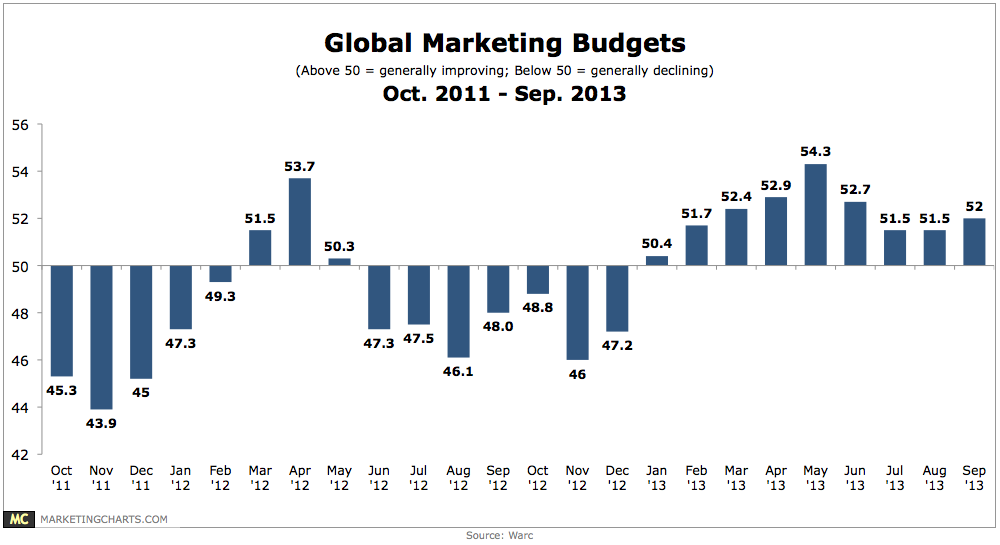
Global marketing budgets continue to improve.
Read MoreMarketing Services Movement From Agency To In-House, May 2013 [CHART]
58% of US client-side marketers said their company used an in-house agency this year, compared to only 42% who five years earlier said the same.
Read MoreUS Online Ad Spending Share By Objective, 2013-2017 [CHART]
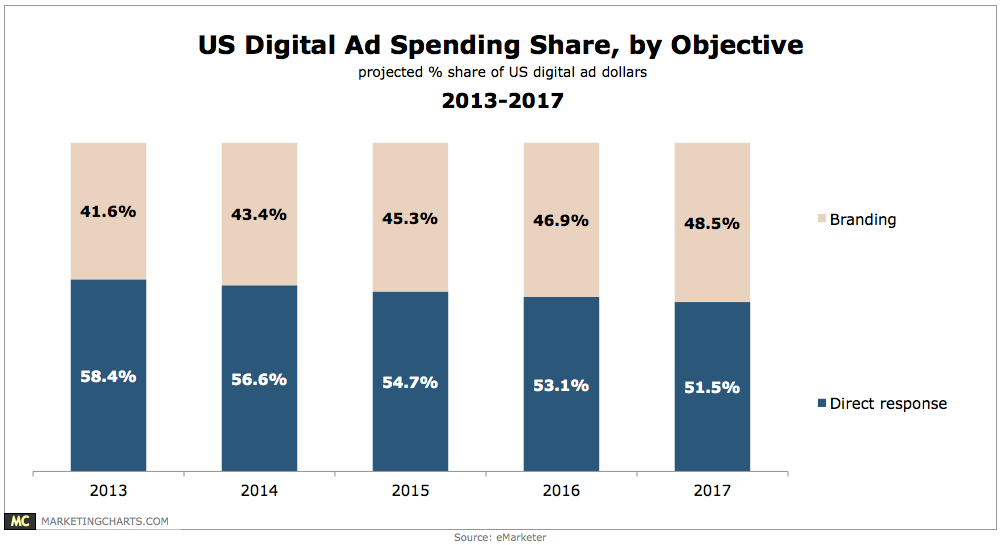
Digital ad spending is currently weighted towards direct response over branding, but that tilt will soon disappear.
Read MoreTop American Companies By Ad Spending, Q2 2012 & Q2 2013 [TABLE]
Retail remained the top spending ad category, but growth in Q2 2013 was minimal compared to a year prior, at only 0.1%.
Read MoreUS Ad Spending Growth By Media [CHART]
For the first half of 2013, Kantar Media estimated that the total US ad spend market rose 2.0%, compared with the same period one year earlier.
Read MoreUS Online Ad Spending Growth & Share By Objective, 2011-2017 [TABLE]
eMarketer estimates that out of a total of $41.94 billion in US digital ad spending in 2013, nearly 60% will go toward direct response.
Read More