Marketing Budgets
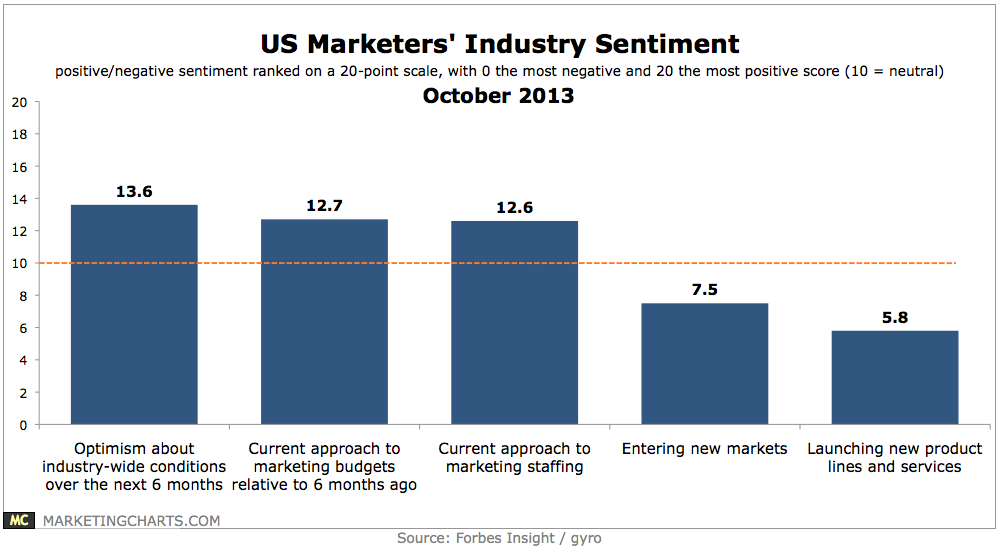
Sentiment Of US Marketers, October 2013 [CHART]
Looking ahead at the next 6 months, 9 in 10 US marketers are either more (46%) or as (45%) optimistic about industry-wide marketing conditions as they are today.
Read MoreB2B Content Marketing [INFOGRAPHIC]
This infographic from LinkedIn illustrate’s B2B content marketing efforts.
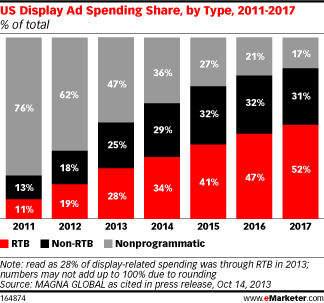
Read MoreDisplay Ad Spending Share By Type, 2011-2017 [CHART]
RTB will account for 28% of display ad buying in the US in 2013, while non-RTB programmatic ad buying will make up 25%.
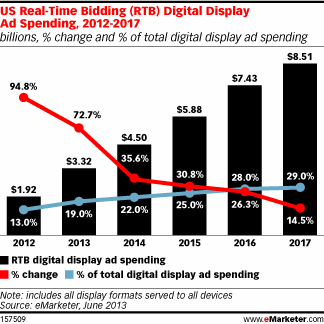
Read MoreReal-Time Bidding Online Display Ad Spending, 2012-2017 [CHART]
RTB for digital display ad spending will reach $3.3 billion in the US in 2013, and see double-digit growth rates through 2017, when it will total $8.5 billion.
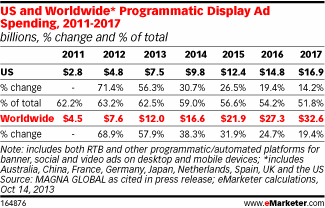
Read MoreProgrammatic Display Ad Spending, 2011-2017 [TABLE]
MAGNA GLOBAL estimated that worldwide programmatic ad spending would hit $12 billion this year, with the US accounting for $7.5 billion of that.
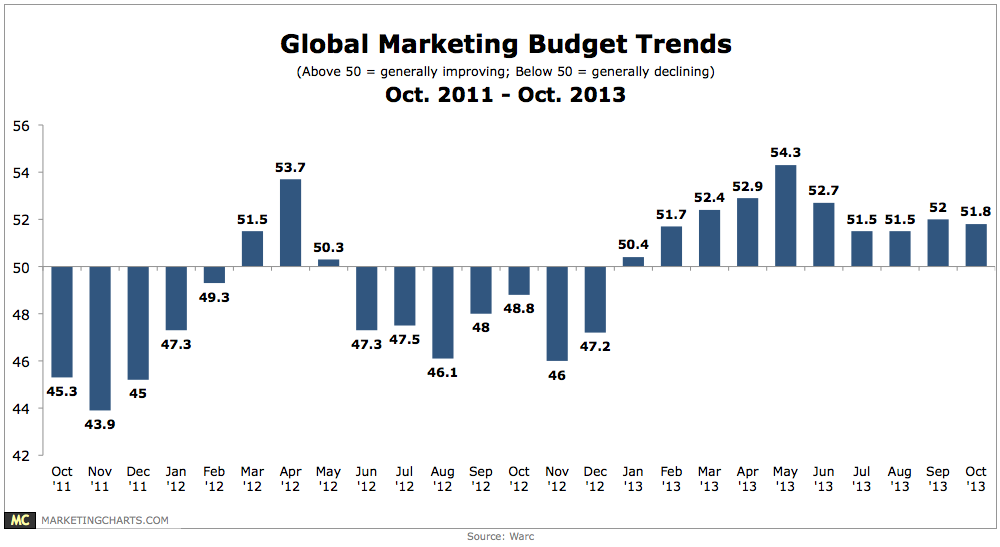
Read MoreGlobal Marketing Budget Trends, October 2011-October 2013 [CHART]
After expanding throughout the Summer months, global marketers’ confidence in their budgets remains solid.
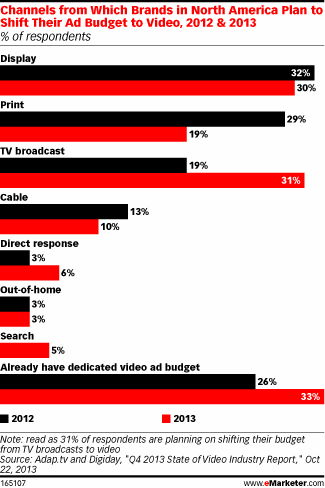
Read MoreChannels From Which Brands Plan To Shift Ad Budgets To Video, 2012 & 2013 [CHART]
31% of brands that responded were planning to shift their advertising budgets away from broadcast television and into online video.
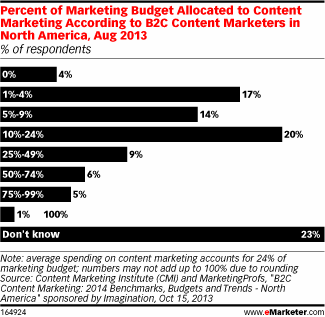
Read MorePercent Of B2C Marketing Budgets Allocated To Content Marketing, August 2013 [CHART]
23% of B2C marketers—a significant number—were unsure how much of their total budget was allocated to the practice of content marketing.
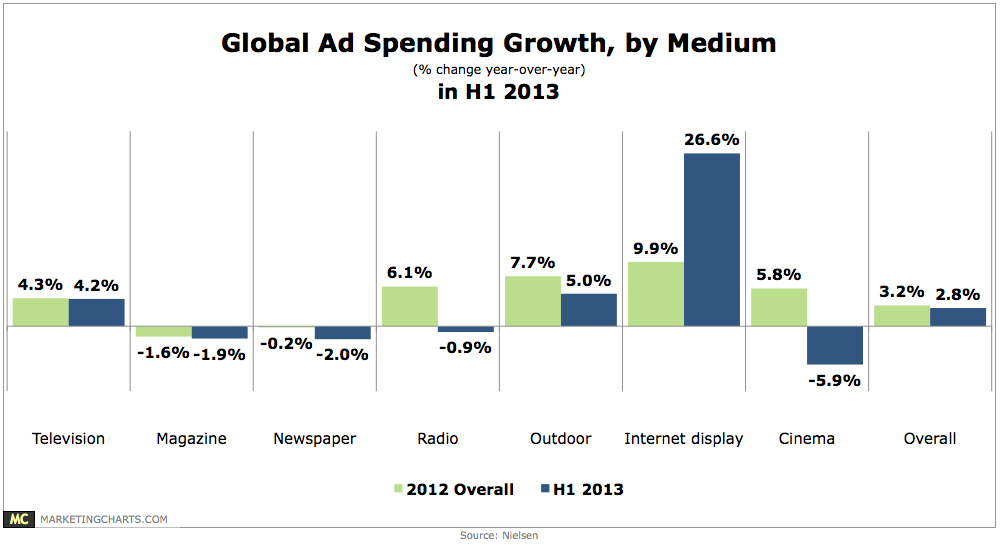
Read MoreGlobal Ad Spend Growth By Medium, H1 2013 [CHART]
Global ad spending across major media grew by 2.8% year-over-year in the first 6 months (H1) of this year, with faster growth noted in Q2 (3.5%), particularly in June (5.8%).
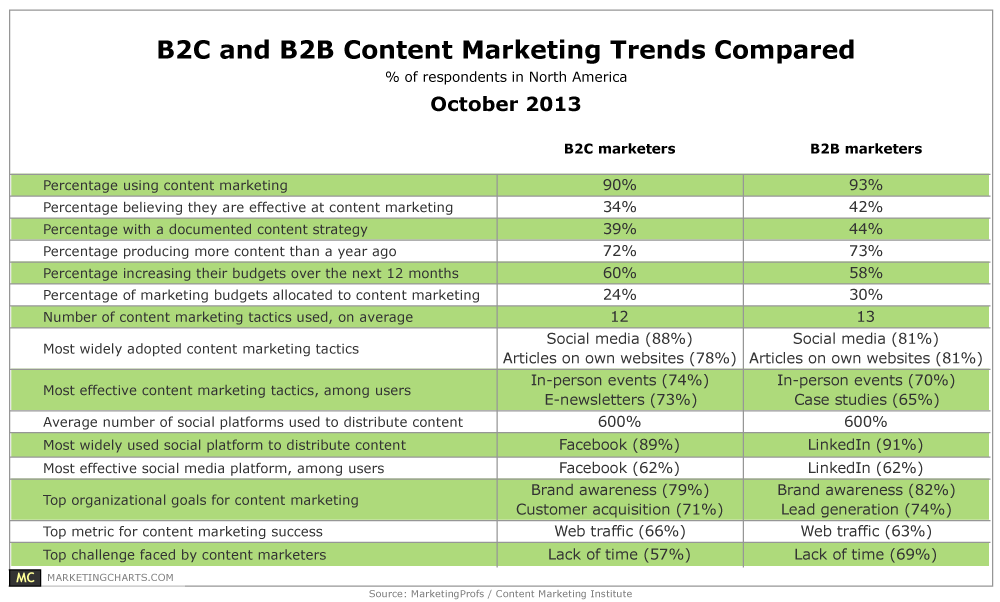
Read MoreB2C vs B2B Content Marketing, October 2013 [TABLE]
B2B marketers have traditionally invested more of their budgets into content marketing than their B2C counterparts.
Read More