Marketing Budgets
Expected Changes In Norwegian Content Marketing Budgets In 2014 [CHART]
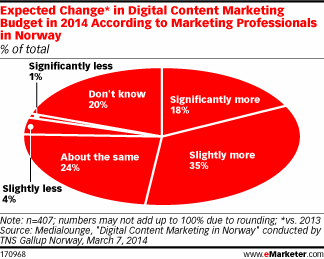
Just over half of respondents spent more on digital content production in 2013 than in 2012.
Read MoreUS Marketers' Personal Approach To Marketing, March 2014 [CHART]
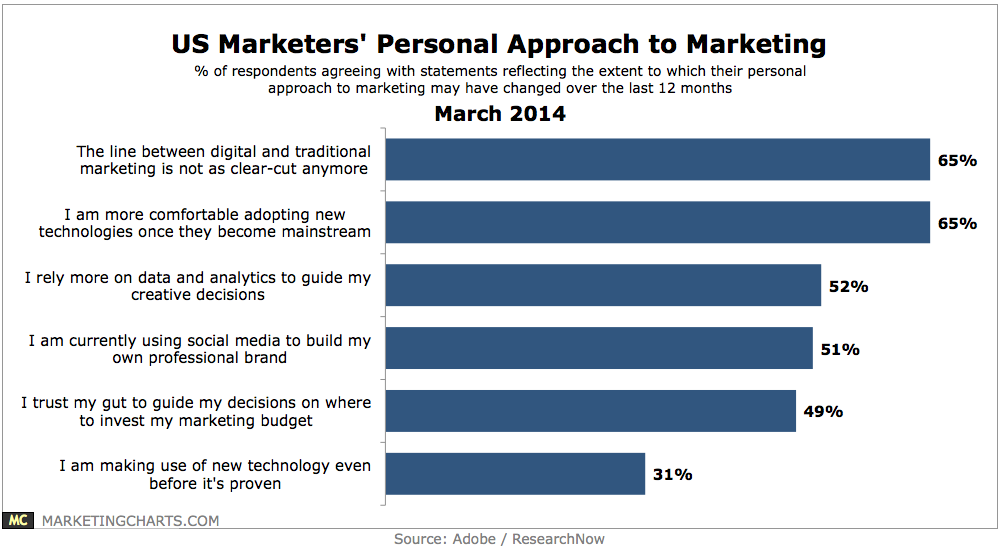
Three-quarters of marketers agree that capturing and applying data to inform and drive marketing activities is the new reality.
Read MoreChange In Measured Ad Spend By Medium, 2012 vs 2013 [CHART]
Overall, TV media spend was basically flat (-0.1%) from 2012, as an off-year for P&O spending was offset by increased ad spending on sports.
Read MoreUS Ad Spending Trends By Advertiser Size, 2013 [CHART]
After growing by 3% in 2012, US advertising outlays inched up by 0.9% year-over-year in 2013 to reach $140.2 billion.
Read MoreGlobal Marketers' Budget Optimism, October 2011 – March 2014 [CHART]
Despite the Q1 dip, budget expectations continue to expand, and are highest in the Americas.
Read MoreUS Social Media Ad Spending By Type, 2012-2017 [TABLE]
Native ad spending on social media alone is estimated to grow from $3.1 billion this year to $5.0 billion in 2017.
Read MoreGlobal Mobile Online Ad Spending, 2012-2018 [CHART]
Last year, global mobile ad spending increased 105.0% to total $17.96 billion.
Read MoreUS Online Ad Spending Growth By Channel, 2012-2018 [TABLE]
US mobile search ad spending grew 120.8% in 2013, contributing to an overall gain of 122.0% for all mobile ads.
Read MoreUS Media Ad Spending Share By Media, 2012-2018 [CHART]
TV will remain the dominant advertising channel, making up 38.1% of total media spending in 2014.
Read MoreEffective Social Media Tactics According To Fast-Growth SMBs, November 2013 [CHART]
Hypergrowth SMBs in North America had seen the most success in branding, cited by nine in 10.
Read More