Marketing Budgets
US Online Video Ad Spending Forecast, Desktop vs Mobile, 2014-2018 [CHART]
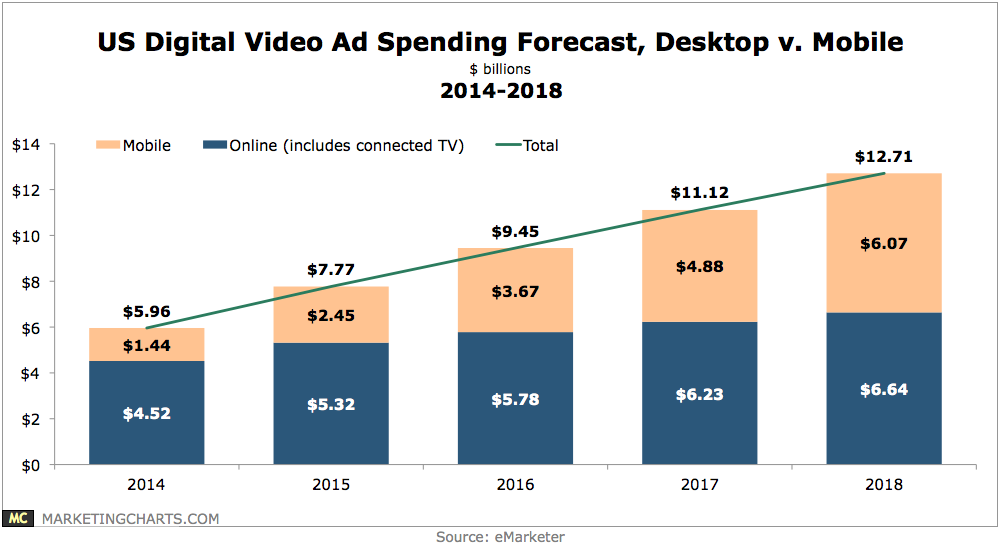
Marketers will spend more than $1.4 billion on mobile video ads this year, or close to one-quarter of total digital video ad spending.
Read MoreUS Online Video Ad Spending By Device, 2012-2018 [CHART]
Online video remains well ahead of ad investments in video programming on smartphones and tablets—for the time being.
Read MoreUS TV vs. Online Ad Spending Increases, 2012-2018 [CHART]
Despite digital video’s astronomical rise percentagewise, eMarketer projects that TV will add more new dollars this year.
Read MoreUS TV vs. Online Video Ad Spending, 2012-2018 [TABLE]
Digital video advertising in the US is increasing at an eye-popping rate, but TV ad spending will still outpace digital video in dollar growth in 2014.
Read MoreData-Driven vs Intuitive Decision-Making, June 2014 [CHART]
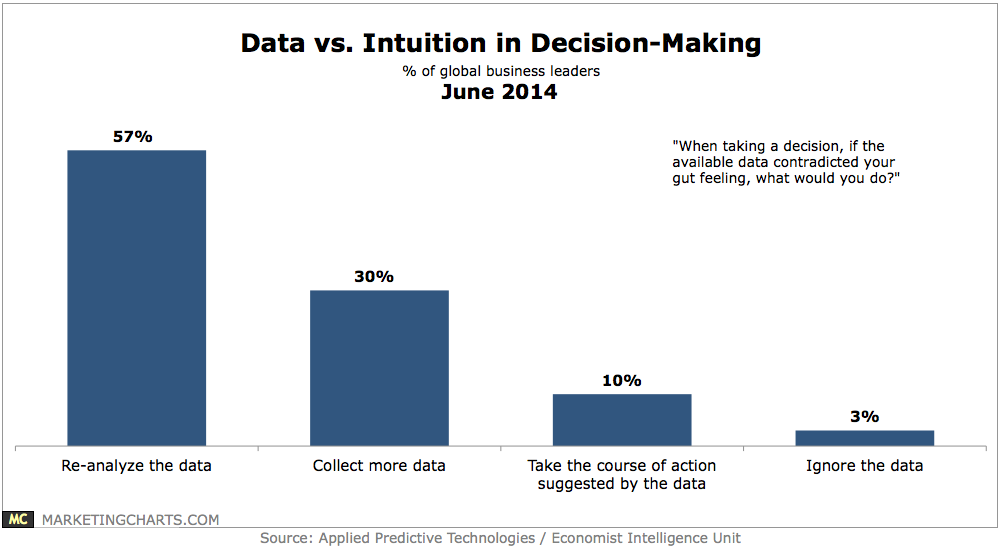
US marketers often rely on their gut for marketing budget decisions.
Read MoreUS Online Video Ad Spending, 2012-2018 [CHART]
Online video advertising will make up nearly 12% of all digital ad spending in the US this year.
Read MoreUS Mobile Search Ad Spending, 2012-2018 [CHART]
Mobile advertising in the US will total $17.73 billion in 2014, with mobile search spending accounting for more than half of that total, or $9.02 billion.
Read MoreGlobal Programmatic Ad Pricing Trends, 2013 vs 2014 [CHART]
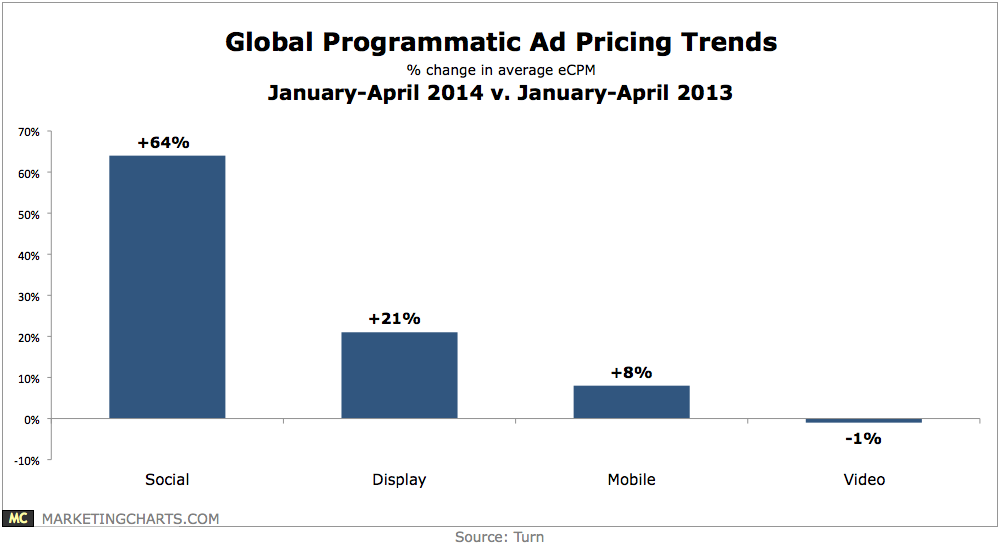
Social and display advertising have become more competitive and seen a 64% and 21% year-over-year increase, respectively, in average eCPM from January through April 2014.
Read MoreWestern European Online Ad Spending By Country, 2012-2018 [TABLE]
Spending on display ads continued to gain momentum, logging higher growth than any other format, at 14.9%, and a total value of $12.27 billion.
Read MoreUS Telecoms Online Ad Spending By Objective, 2014 [CHART]
Telecom is in line with US industry averages when it comes to the mix between direct-response and brand-driven advertising.
Read More