International
Changing Role Of Online Channels Within The Purchase Journey, October 2014 [TABLE]
Few digital shoppers in developed countries feel that social media will play an increased role in their shopping journeys over the next 3 years.
Read MoreFrequency Of Sharing Videos [INFOGRAPHIC]
Frequency Of Sharing Videos Infographic: Of the 17.9% who are sharing videos at least once a week, 8.6% are sharing daily.
Read MoreGlobal YouTube Video Views [INFOGRAPHIC]
Global YouTube Video Views Infographic: Less than 25% of video views worldwide are watched on YouTube.
Read MoreInfluences Over Consumers' Purchase Decisions, November 2014 [CHART]
Word-of-mouth tops online reviews and traditional advertising as the top influencer of purchase decisions.
Read MoreWhy Consumers Go Online, November 2014 [TABLE]
There are 4 primary reasons why consumers go online: interpersonal connections; self-expression; exploration; and convenience.
Read MoreUK CMOs' & CFOs' Views Of The Value of Marketing, November 2014 [CHART]
About half of the marketers surveyed believe that more than 30% of their organization’s revenues are directly driven by marketing activity.
Read MoreGlobal Netflix Hours Streamed Per Month Per Subscriber, 2011-2014 [CHART]
US Netflix subscribers’ total streaming hours have almost tripled from 1.8 billion in Q4 2011 to 5.1 billion in Q2 2014
Read MoreAdvertising Cost Per App Install By Country & OS, Q3 2014 [CHART]
For app advertisers, the cost per install (CPI) is significantly higher on iOS than Android devices.
Read MoreCreativity In Large Organizations, September 2014 [CHART]
Fewer than 4 in 10 decision-makers from large enterprises who influence creative software purchases feel that their company compares well with firms recognized for their creativity.
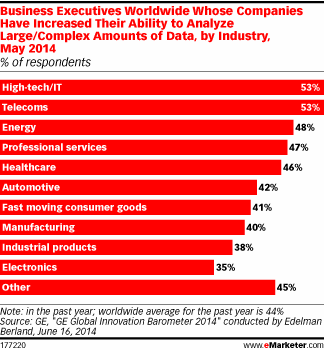
Read MoreGlobal Businesses Analyzing Big Data By Industry, May 2014 [CHART]
On average, 44% of companies had increased their ability to understand large sets of data.
Read More