International
Global Online Video Completion Rates By Device, Q1 2013 [TABLE]
Tablets showed a higher video completion rate than either PCs or other mobile devices.
Read MoreJournalists' Trust In Various Sources, 2013 [CHART]
The sources most trusted by journalists were academics and other experts, who were trusted by 70 percent of journalists.
Read MoreJournalists' Personal Use Of Social Media Worldwide, 2013 [CHART]
55% of journalists agree that blogs are a great way to build a personal profile, and 34% have one.
Read MoreGlobal Internet-Connected Car System Sales By Type, 2009-2018 [TABLE]
Last year’s global shipments of cars with embedded technology reached 5.44 million, and by 2018 that number will grow to 35.94 million.
Read MoreGlobal eCommerce Penetration By Country, 2011-2017 [TABLE]
Western Europe and North America are the only regions in the world where a majority of the online population is also a digital buyer.
Read MoreGlobal B2C eCommerce Sales By Region & Country, 2011-2016 [TABLE]
Other fast-growing regions include Latin America, where total spending will reach $45.98 billion this year, or 3.8% of the total.
Read MoreGlobal B2C eCommerce Sales Growth By Region & Country, 2011-2017 [TABLE]
Asia-Pacific already accounts for nearly a third of all B2C eCommerce sales in the world, a share of the total just below North America’s.
Read MoreGlobal B2C eCommerce Sales By Region, 2011-2016 [TABLE]
This year alone, B2C ecommerce sales are expected to grow 23% in the Asia-Pacific region.
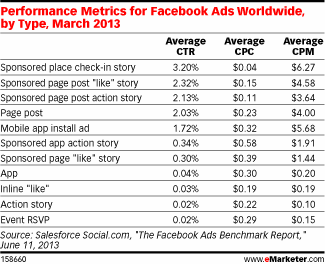
Read MoreGlobal Facebook Ad Performance Metrics By Type, March 2013 [TABLE]
The sponsored check-in story achieved the highest clickthrough rate (CTR) by a significant margin.
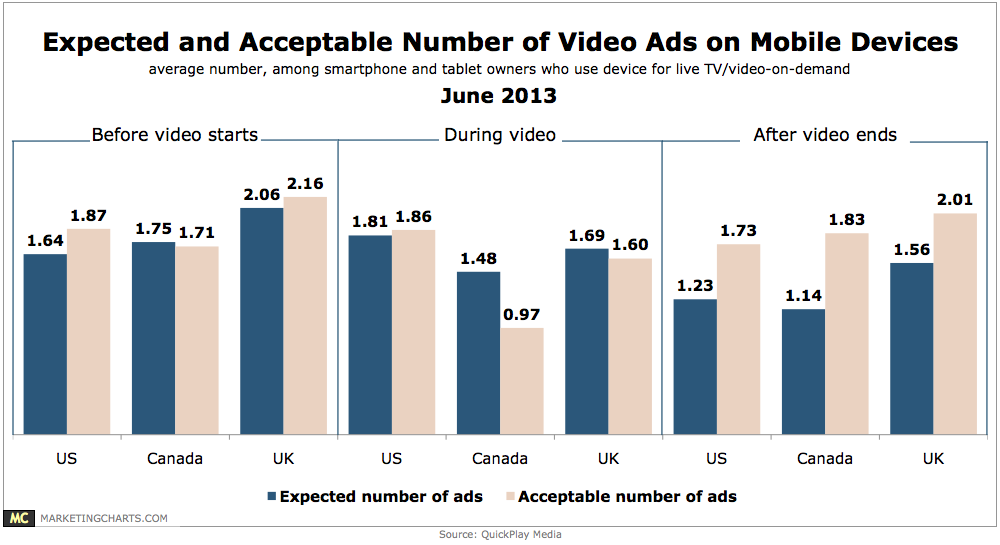
Read MoreExpectation & Tolerance For Mobile Video Ads, June 2013 [CHART]
Research from comScore has shown that the average TV show is about one-quarter ads, while new figures from comScore indicate that online video ads accounted for just 2.6% of all minutes spent watching online video last month.
Read More
