International
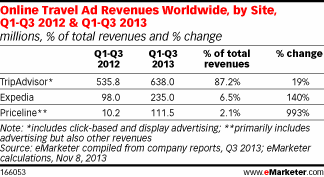
Global Online Travel Ad Revenues By Site, 2012 vs 2013 [TABLE]
Travel metasearch sites are influencing the marketplace for digital travel shopping and booking,
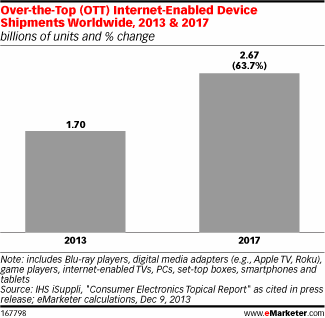
Read MoreGlobal Over-the-Top Online Enabled Device Shipments, 2013 & 2017 [CHART]
Shipments of over-the-top (OTT) devices reached an estimated 1.67 billion worldwide in 2013.
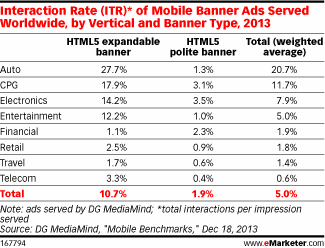
Read MoreGlobal Mobile Banner Ad Interaction Rates, 2013 [TABLE]
Mobile expandable banners had greater success in engaging customers than polite banners across almost all verticals.
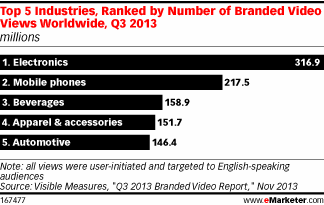
Read MoreTop 5 Industries By Number Of Branded Video Views, Q3 2013 [CHART]
The top industry for such views was electronics, which ranked far ahead of runner-up mobile phones.
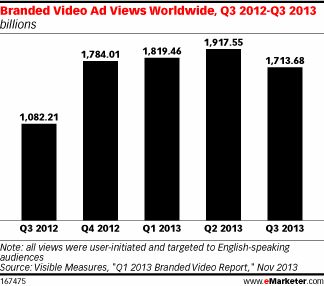
Read MoreGlobal Branded Video Views, Q3 2012-Q3 2013 [CHART]
Branded videos skyrocketed in viewership worldwide between the end of 2012 and 2013.
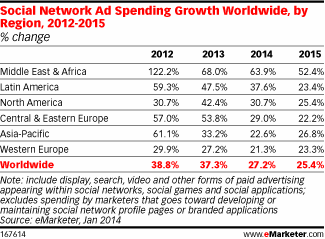
Read MoreGlobal Social Network Ad Spending Growth By Region, 2012-2015 [TABLE]
Overall, social network ad spending is growing most quickly in the Middle East and Africa.
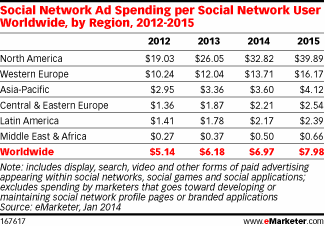
Read MoreGlobal Social Media Ad Spending Per Social Network User By Region, 2012-2015 [TABLE]
Advertisers will invest $32.82 on social network advertising per social network user in North America this year, up from just over $26 in 2013.
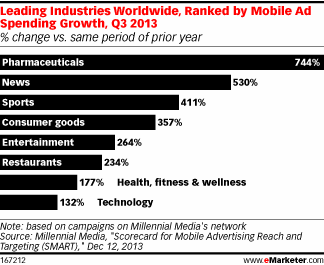
Read MoreGlobal Mobile Ad Spending Growth By Industry, Q3 2013 [CHART]
The pharmaceutical industry has done the most to increase mobile ad spending as of Q3 2013.
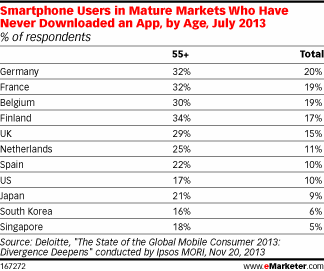
Read MoreSmart Phone Users Who Have Never Downloaded An App…I Know, Right? [TABLE]
Those ages 55 and up were significantly more likely than average to say they never had downloaded an app on their smart phone.
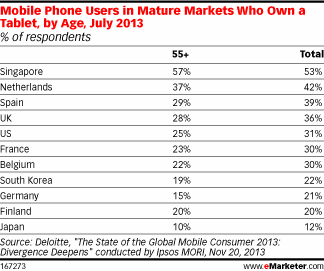
Read MoreGlobal Mobile Phone Users Who Own A Tablet, July 2013 [TABLE]
Varying levels of tablet ownership exist among mobile phone users, ranging from just 12% in Japan to 53% in Singapore.
Read More