International
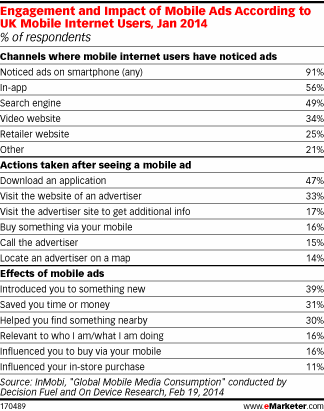
Engagement & Impact Of Mobile Ads In UK, January 2014 [TABLE]
Because UK mobile internet users spend so much time with apps, it comes as no surprise to learn that in-app ads are the most commonly seen.
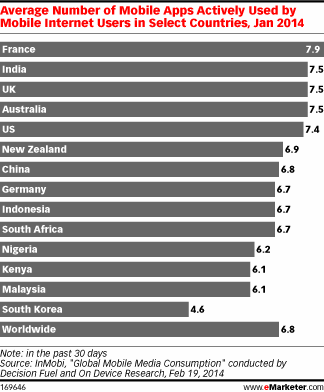
Read MoreAverage Number Of Mobile Apps Actively Used By Country, January 2014 [CHART]
The majority of non-voice mobile time is likely being spent with apps rather than the mobile web.
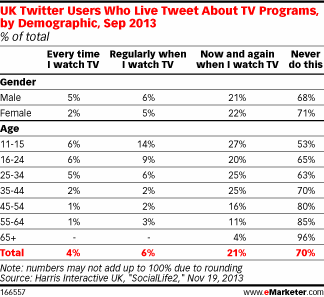
Read MoreUK Social TV Viewers By Demographic, September 2013 [TABLE]
Nearly two-thirds of UK 16- to 24-year-olds who used Twitter said they never live tweeted about TV programs.
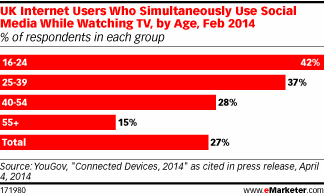
Read MoreUK Multitainment Use By Age, February 2014 [CHART]
Social media usage while watching TV was still a minority activity among older teens and early 20-somethings in the UK.
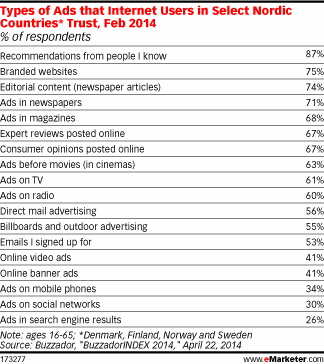
Read MoreTypes Of Ads Nordic Residents Most Trust, February 2014 [TABLE]
Around one-third said they trusted ads on mobile phones, and three in 10 said the same for those on social networks.
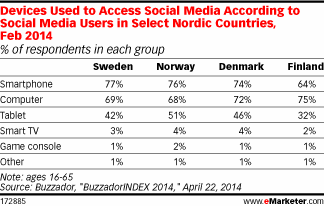
Read MoreDevices Nordic Citizens Use For Social Media, February 2014 [TABLE]
An average 58% of smartphone owners in the region had their device within reach at least 20 hours per day.
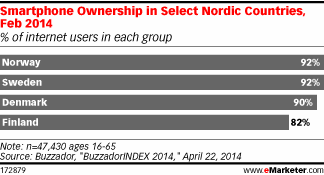
Read MoreSmart Phone Ownership In Nordic Countries, February 2014 [CHART]
In the Nordic countries combined—Sweden, Norway, Finland and Denmark—smartphones have surpassed laptops and TVs to become the most-owned device.
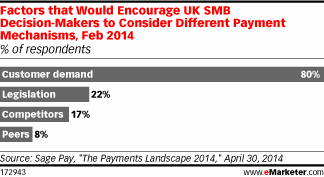
Read MoreFactors That Would Encourage UK SMBs To Different Payment Mechanisms, February 2014 [CHART]
80% of United Kindom SMB decision-makers would consider different payment mechanisms based on customer demand.
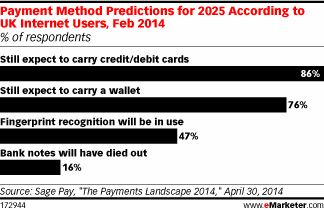
Read MoreUK Payment Method Predictions For 2025, February 2014 [CHART]
86% of UK internet users still expected to be carrying credit and debit cards in 2025, while 76% said they’d be lugging a physical wallet.
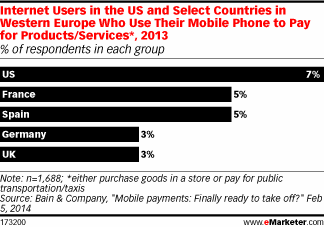
Read MoreMobile Payment Consumers By Select Countries, 2013 [CHART]
55% of UK internet users knew of mobile payments, but only 3% actually used their mobile phones to pay for transportation or goods in-store.
Read More