Household Income
American's Attitudes Toward Screen Time By Demographic, July 2015 [CHART]
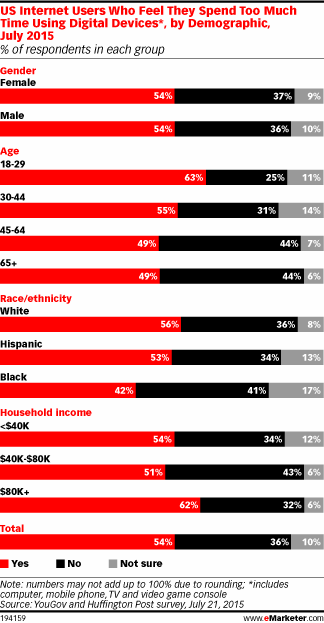
54% of US internet users said they spent too much time using digital devices, including computers, mobile phones, TVs and video game consoles.
Read MoreAlcohol Preferences By Income & Education, July 2015 [CHART]
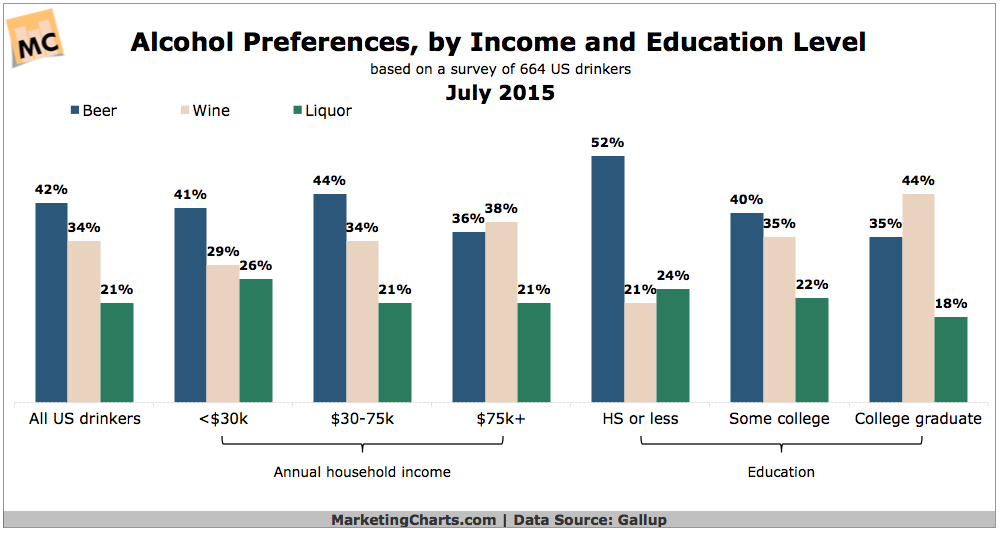
Self-reported alcoholic consumption is far higher among Americans from high-income households than lower-income households.
Read MoreInternet Adoption By Demographic, 2000-2015 [TABLE]
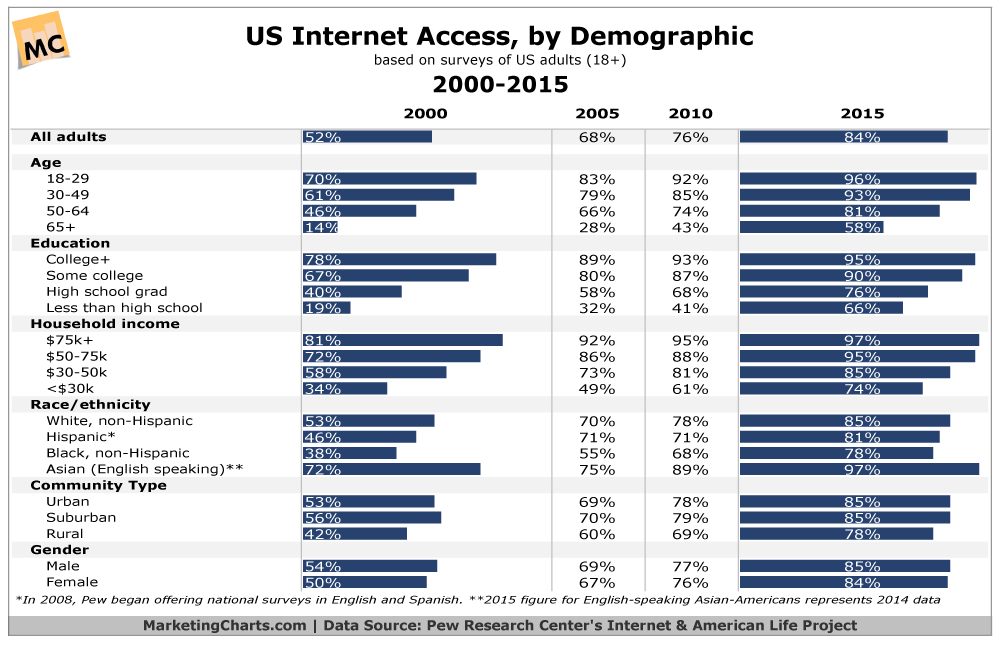
The overall Internet adoption rate among US adults stands at 84% this year as it has since 2013, and is up from 52% in 2000.
Read MoreOrange Is The New Black Fans On Social [INFOGRAPHIC]
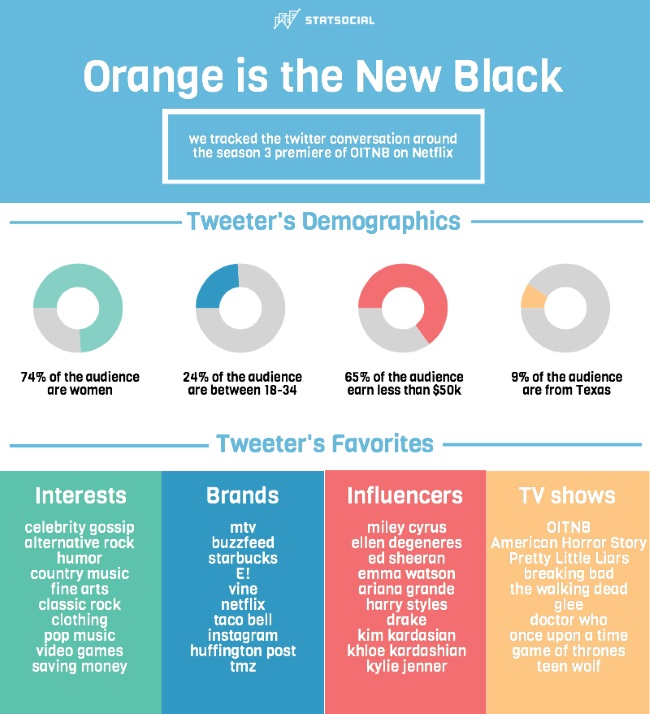
This infographic looks at the demographics and psychographics of Netflix’s Orange Is The New Black fans on social media.
Read MoreTeen Access To Consumer Electronic Devices, April 2015 [TABLE]
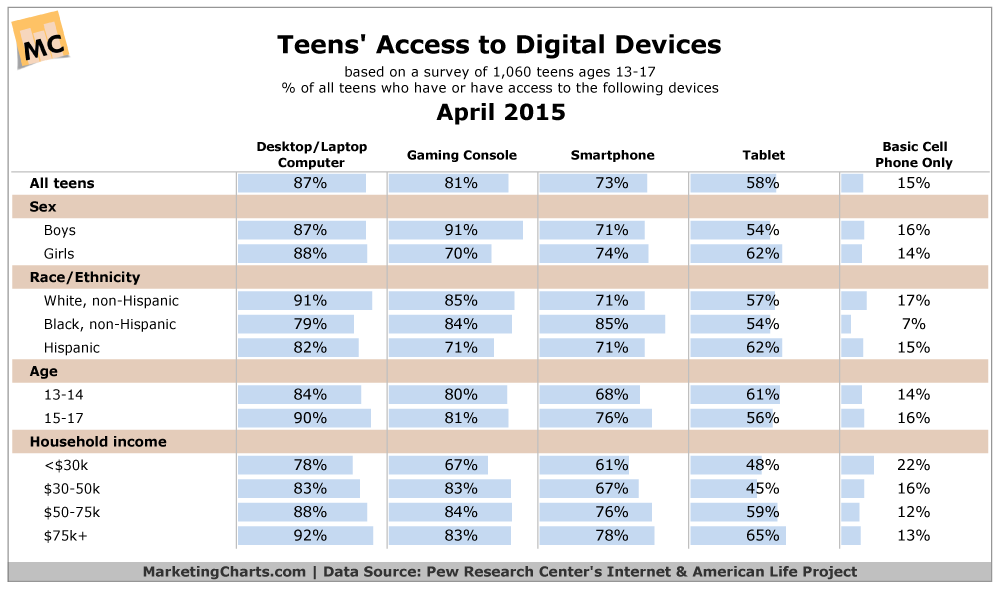
Some 87% of teens aged 13-17 own or have access to a desktop or laptop computer, while 81% have access to a gaming console.
Read MoreStreaming Video On-Demand Penetration By Income, November 2014 [CHART]
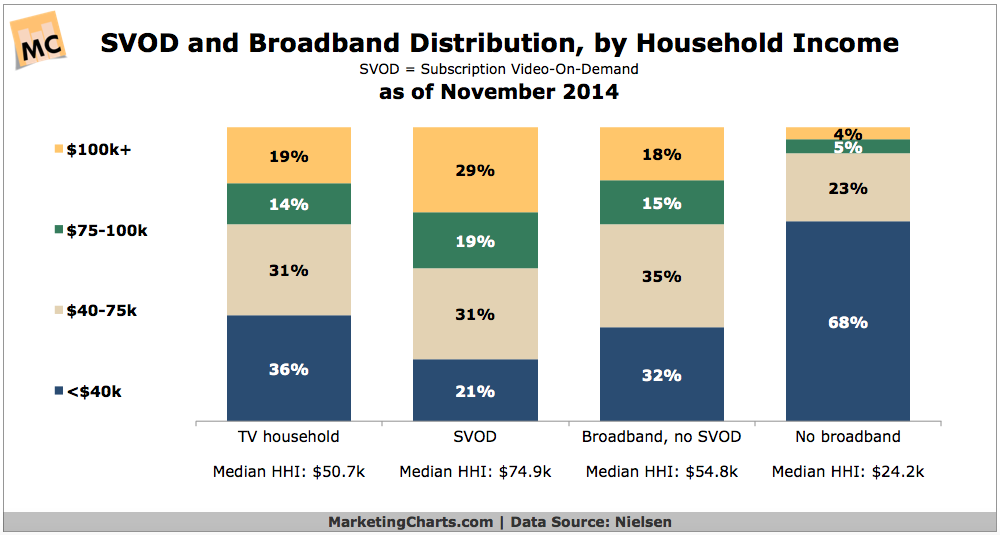
4 in 10 US TV homes had access to at least one subscription video on demand service as of November 2014.
Read MoreHigh-Net-Worth Households, 1997-2014 [CHART]
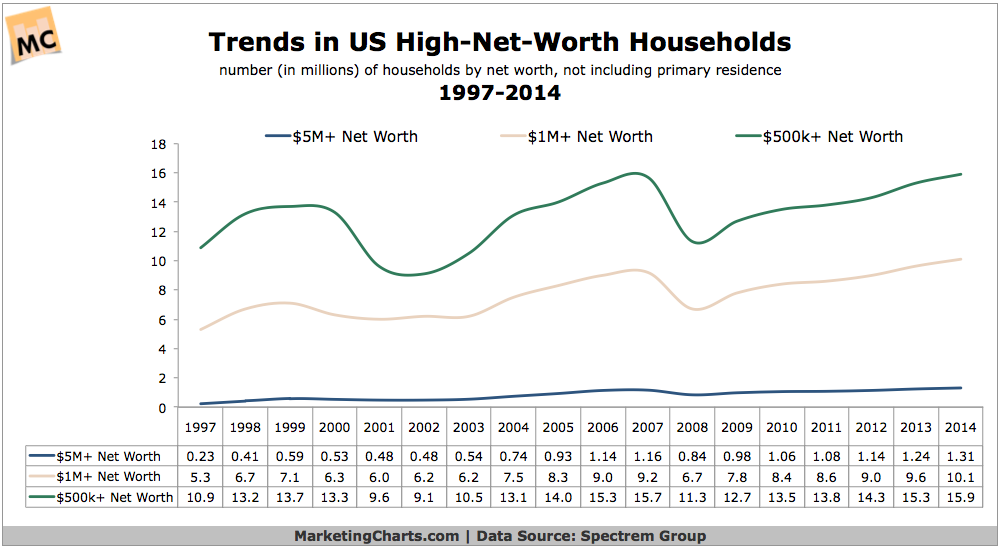
There were 10.1 million US households with net worth of at least $1 million, last year, up from 9.6 million in 2013 and the highest level on record.
Read MoreAmericans' Assessments Of Their Own Financial Situation [TABLE]
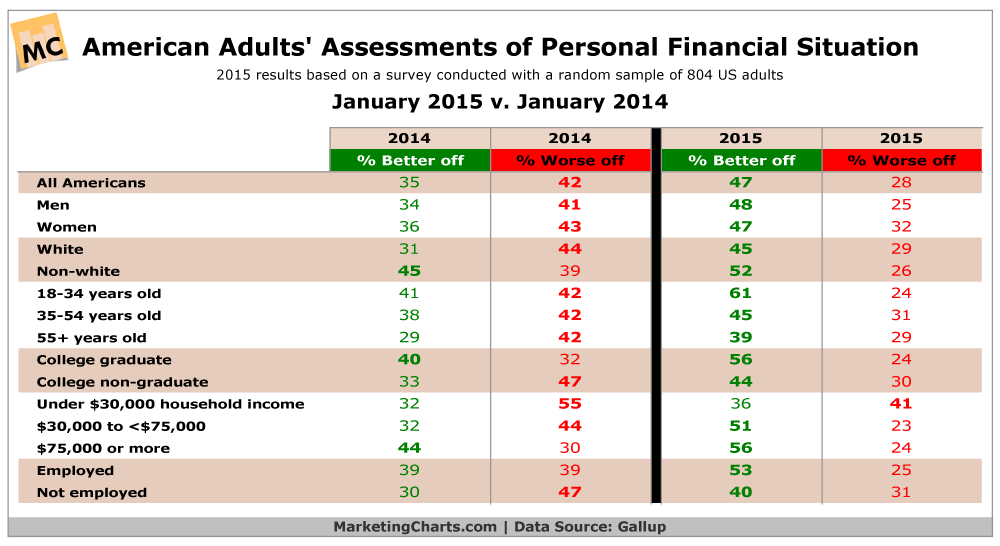
American adults are feeling better about their personal financial situations this year.
Read MoreLinkedIn Demographics [TABLE]
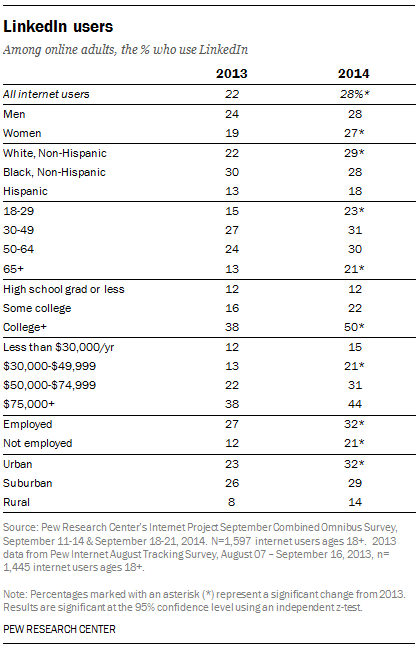
Some 28% of online adults are LinkedIn users, up from 22% in August 2013.
Read MorePinterest Demographics [TABLE]
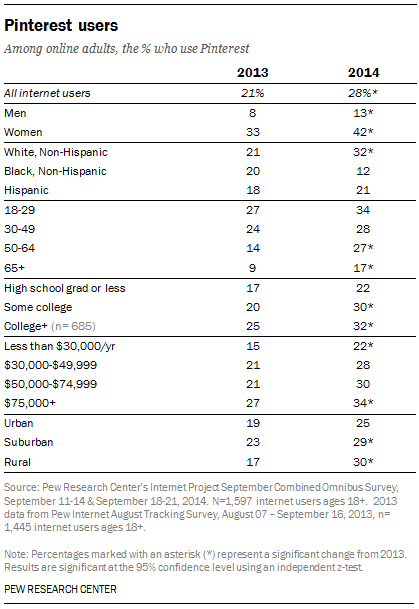
Some 28% of online adults use Pinterest, up from the 21% who did so in August 2013.
Read More