Generations
Facebook Brand Page Reach By Age, 2013 [CHART]
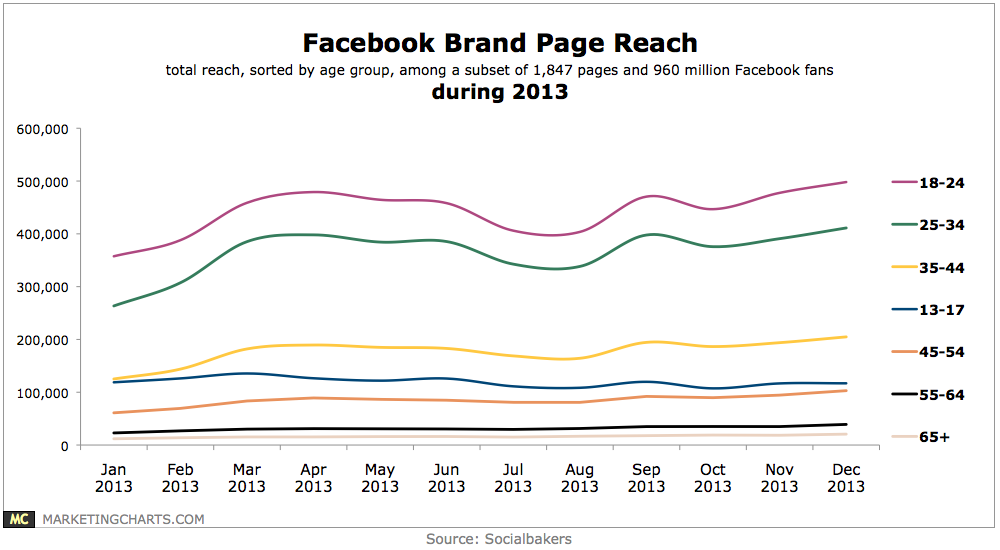
Reach among 18-24-year-olds ended the year about 39% higher than it started.
Read MoreAmerican Tablet Adoption By Demographic As Of January 2014 [CHART]
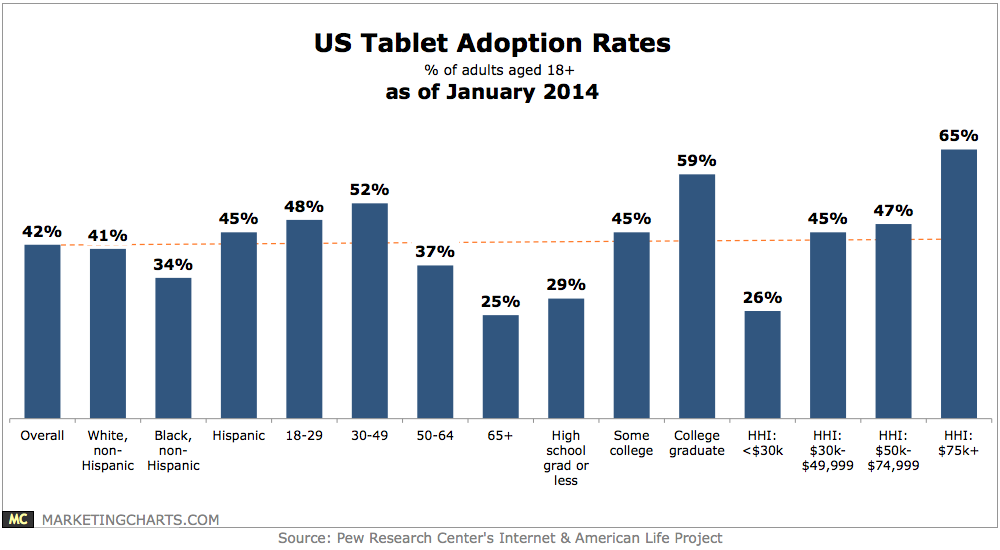
The 30-49 age group continues to have the highest tablet adoption rate – of 52% – although the 18-29 demo has closed the gap by virtue of its 48% penetration rate.
Read MoreConsumer Spending Philosophies By Generation, January 2014 [CHART]
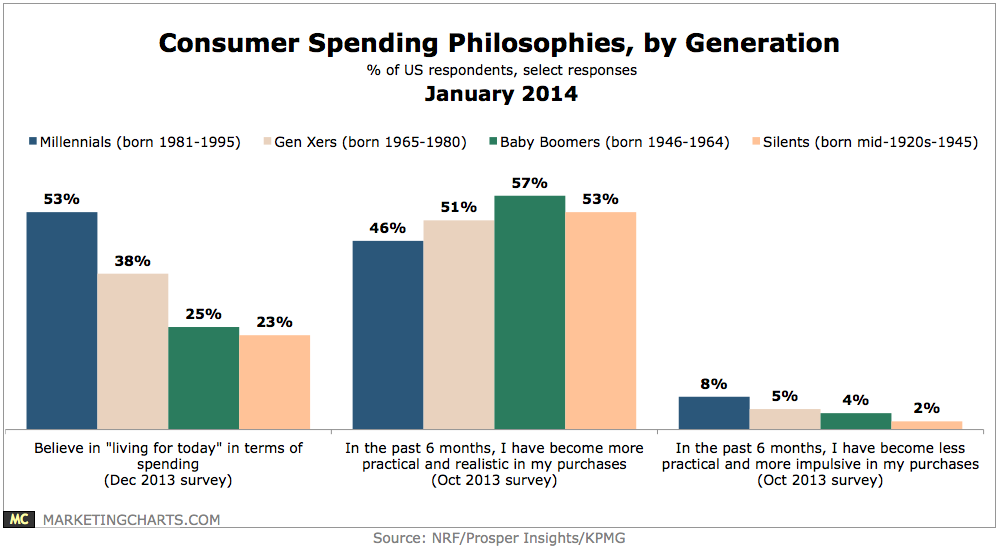
A slight majority – 53% – of Millennials (born 1981-1995) say they have a Live For Today spending philosophy, a mindset which is not shared by older generations
Read MoreLikelihood Of Making A Purchase From A Social Network, January 2014 [CHART]
Almost 1 in 5 social network users will make a purchase directly through a social platform this year.
Read MoreParents Who Have Or Will Buy Mobile Apps For Their Children, November 2013 [CHART]

Most parents in the US—68%—already had or intended to purchase apps for their children ages 2 to 10.
Read MoreDaily Time Spent Online By Age, 2012 vs 2013 [CHART]
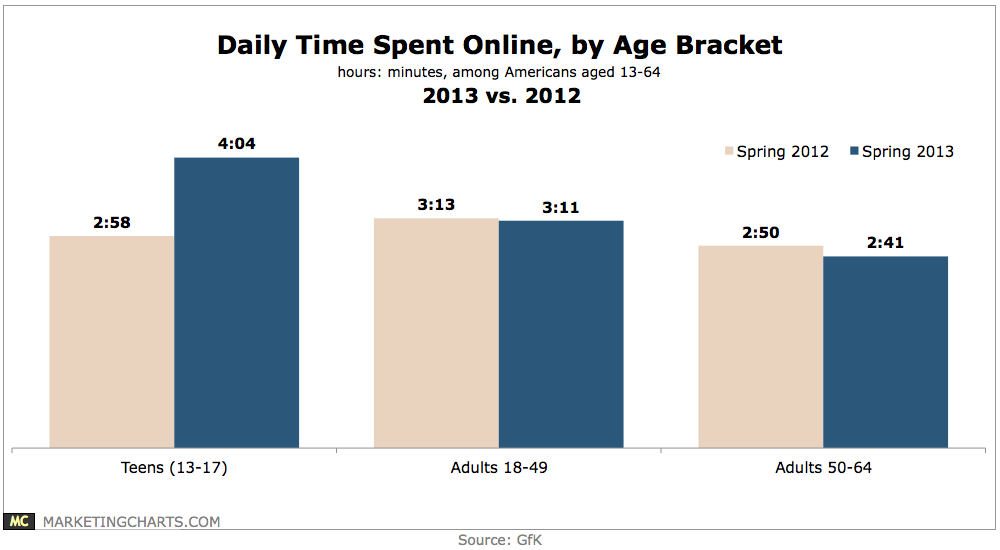
13-17-year-olds spent an average of 4 hours and 4 minutes per day online, a 37% hike from just under 3 hours per day a year earlier.
Read MoreConsumers & Brand Engagement By Generation, January 2014 [CHART]
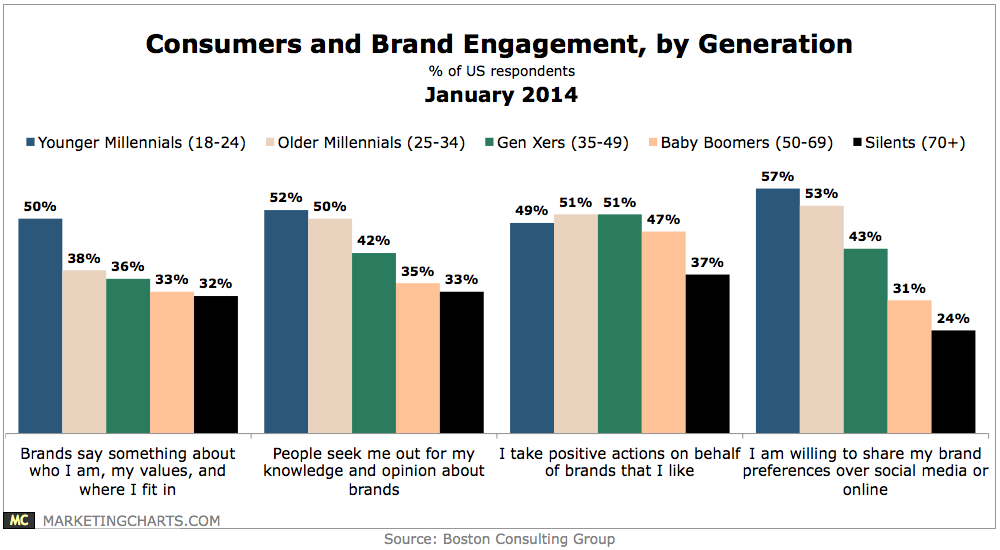
Roughly half of younger US Millennials (18-24) agree that brands say something about who they are, what their values are, and where they fit in.
Read MoreMartin Luther King, Jr. Day In The Workplace [INFOGRAPHIC]
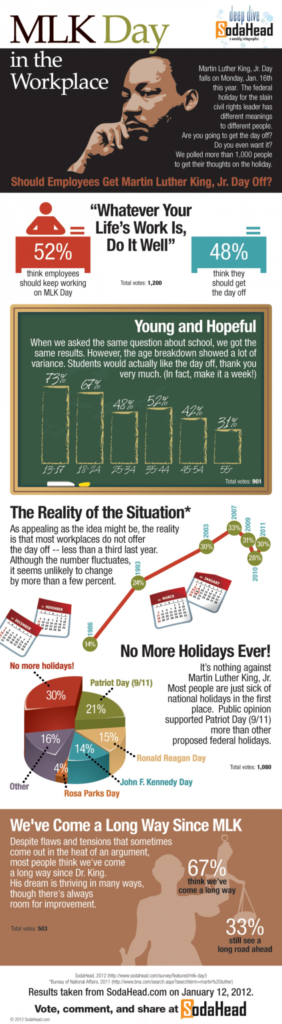
This infographic from SodaHead is based on a 2012 survey of 1000 people’s thoughts about MLK Jr. Day in the workplace.
Read MoreThe Varieties Of Selfies [INFOGRAPHIC]
This inforgraphic from Marketo illustrates the various types of selfie photos.
Read MoreOnline Behavior Of The Home Improvement Customer [INFOGRAPHIC]
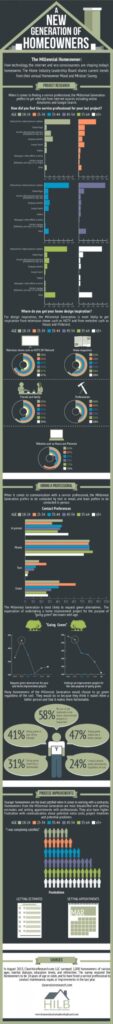
This infographic illustrates the online behavior of home improvement customers by generation.
Read More