Video Games
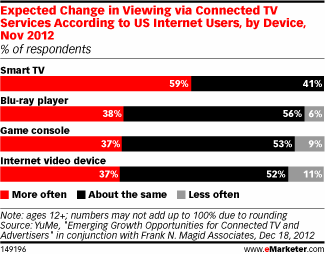
Expected Change In Connected TV Viewing Behavior By Device, November 2012 [CHART]
A nearly equal percentage of respondents expected to increase their connected TV viewing on consoles, Blu-ray players and internet video devices.
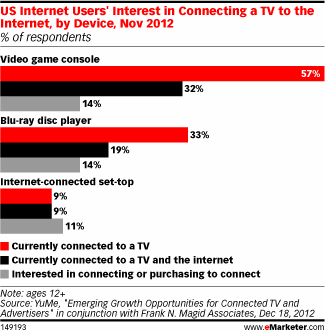
Read MoreInterest In Connecting TVs To The Internet By Device, November 2012 [CHART]
TVs connected to the internet either directly or through an external device are expected to reach 42% of US households by the end of next year.
Read MoreTime Spent Online By Activity & Device, 2012 [CHART]
Social media captures 31% of smartphone internet time, compared to 18% of PC internet time.
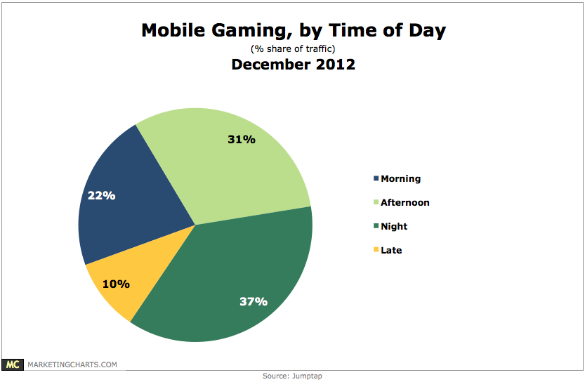
Read MoreMobile Gaming By Time Of Day, December 2012 [CHART]
Mobile gamers place a high level of value on the experience gaming provides and they’re most likely to want to have that experience at night time.
Read MoreUS Mobile Gaming Revenues, 2010-2016 [CHART]
US mobile gaming revenue will come from a combination of paid downloads, in-game purchases of virtual goods and in-game advertising.
Read MoreMobile Content Activities, June 2012 [CHART]
Game playing topped the list of mobile content activities among US tablet owners in June 2012, with 59% of respondents having done this activity.
Read MoreMobile, Online Casual & Social Gamers, 2010-2014 [CHART]
US audiences for mobile games are growing rapidly, while audiences for social and online casual gaming are expected to grow more modestly.
Read MoreTime Spent With Mobile Apps By Category, November 2012 [CHART]
US consumers spent an average 127 minutes on mobile apps per day. That’s up 35% from 94 minutes spent per day in December 2011.
Read MoreMillennials & Branded Entertainment, December 2012 [CHART]
4 in 10 Millennials from around the world want brands to allow them to influence their products (co-creation).
Read MoreBeyond Social Media: Take This Job & Shove It, Montana [PODCAST]
This week’s highlights include a Facebook status update fail by Montana tourism; 3D Printable guns; 50 Shades Of Chicken and shoppable videos.
Read More


