Ethnic Marketing
Connected TV Penetration [CHART]
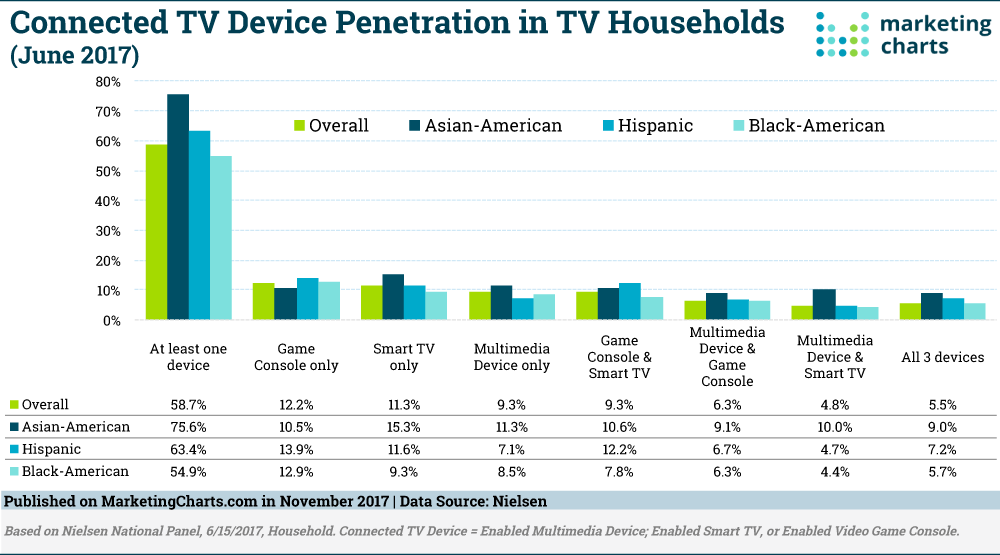
The share of TV households with a Multimedia Device, Game Console and/or Smart TV has broadened to 58.7%, up from 52.2% during the year-earlier period.
Read MoreBlack & Hispanic Mobile Audio Streaming [CHART]
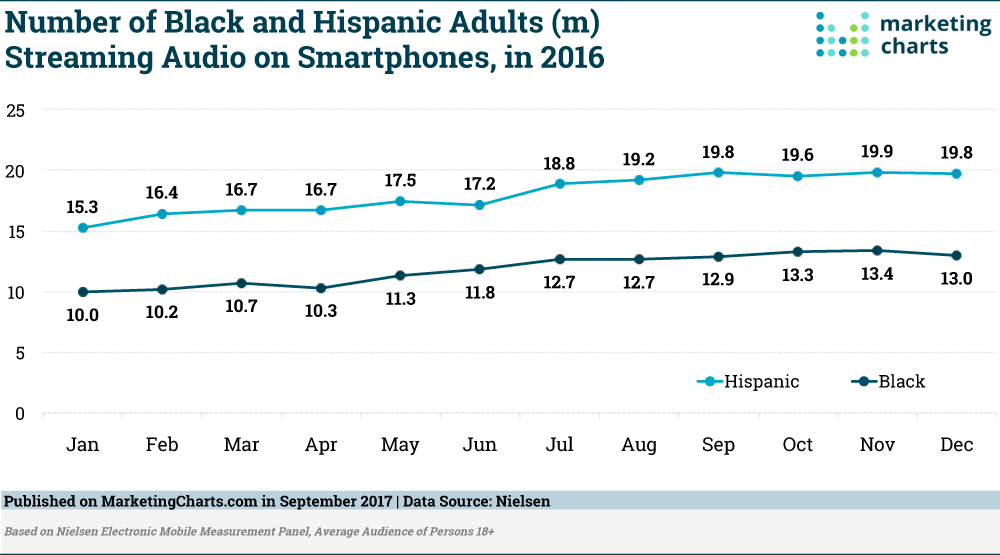
81% of Black adults and 91% of Hispanic adults using smartphones on a weekly basis as of Q4 2016, these devices are increasingly being used for streaming.
Read MoreConsumer Attitudes Toward Facial Recognition By Demographic [TABLE]
There’s no denying that smartphones with biometrics will soon be the norm. But consumers are somewhat split when it comes to mobile devices with facial recognition capability,
Read MoreSocial Media Demographics By Channel [CHART]
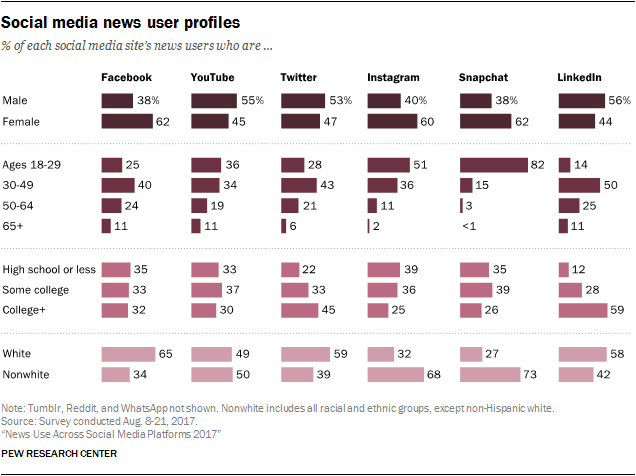
There are some key differences in the demographic makeup of each site’s news users. Instagram and Snapchat news consumers are considerably more likely to be nonwhite and younger.
Read More55% Of 50+ Americans Get News From Social Media [CHART]
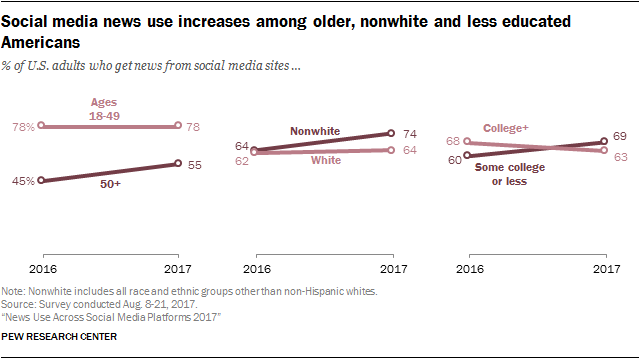
For the first time in the Pew Center’s surveys, more than half of Americans ages 50 or older report getting news on social media sites.
Read MoreHow People Watch TV By Ethnicity [TABLE]
Live TV remains the most popular method of watching TV programming overall in the US. However, new media channels are catching up with the traditional way of watching TV shows.
Read MoreNon-White American Citizens By Age [CHART]
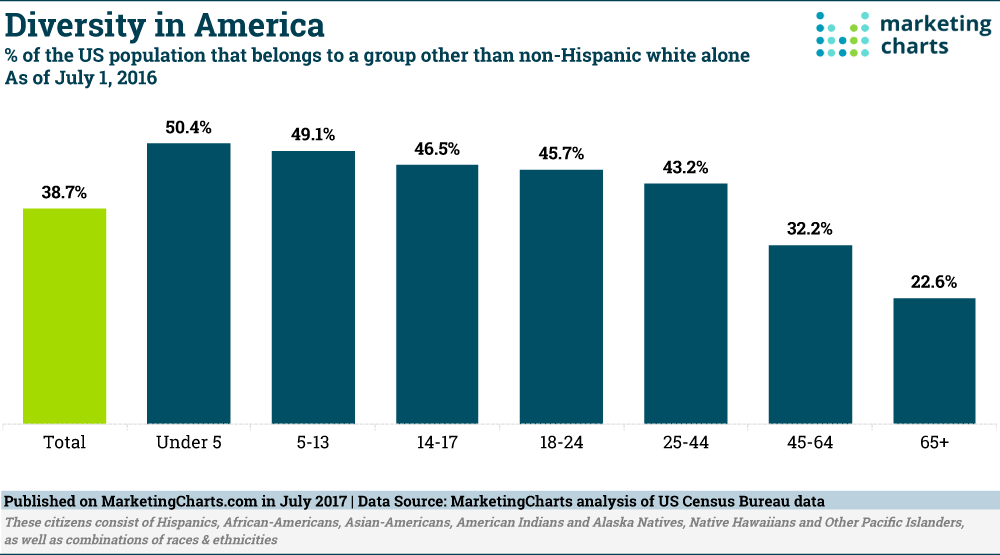
48.9% of all Americans under the age of 18 identify as a race or ethnicity other than non-Hispanic white alone.
Read MoreRacist Searches By State [MAP]
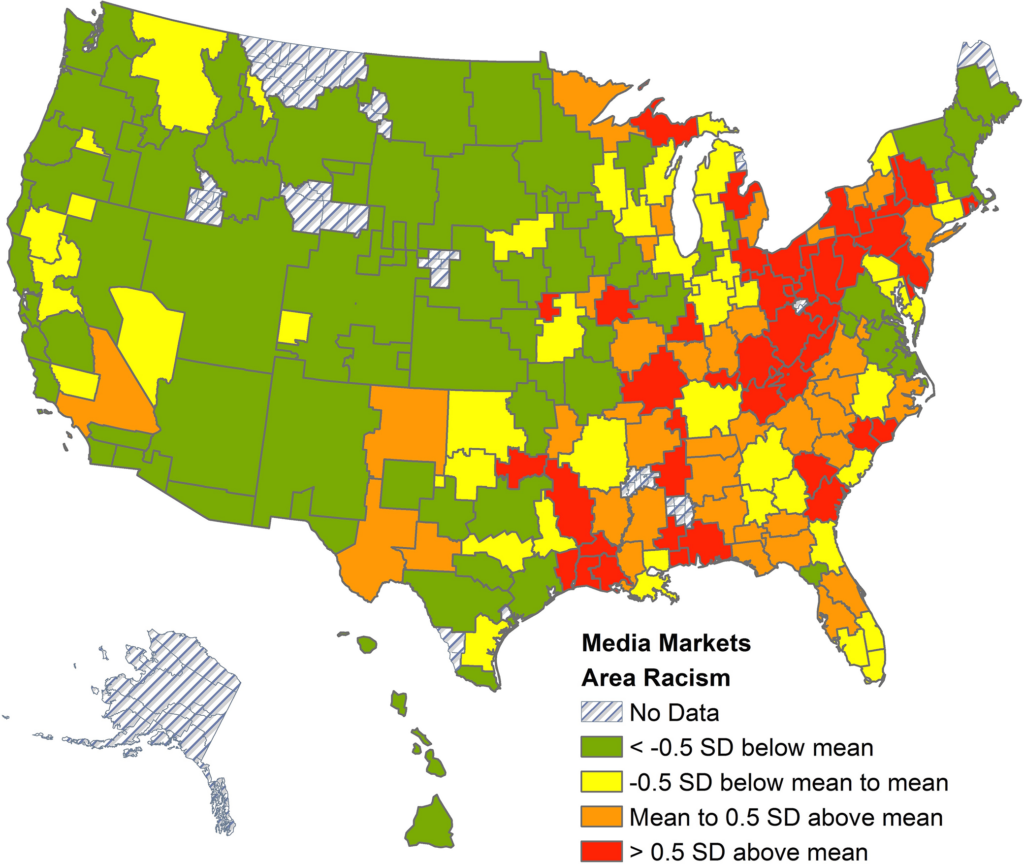
Where do America’s most racist people live? ‘The rural Northeast and South,’ suggests a new study just published in PLOS ONE.
Read MoreConsumer Interest In Snapchat Spectacles [CHART]
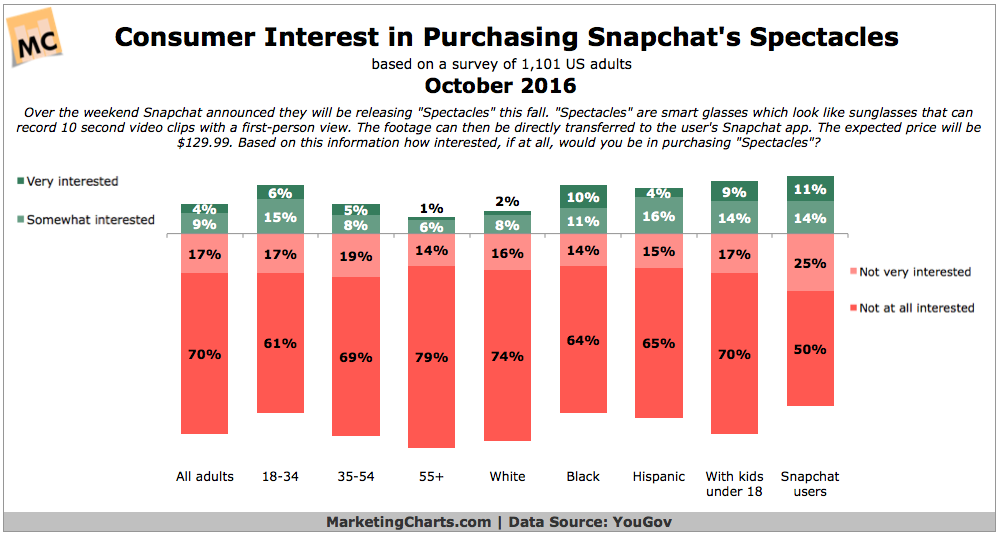
Snapchat’s announcement of its Spectacles sunglasses has been met with a lukewarm reception from American adults.
Read MoreNumber Of TV Channels Americans Watch [CHART]
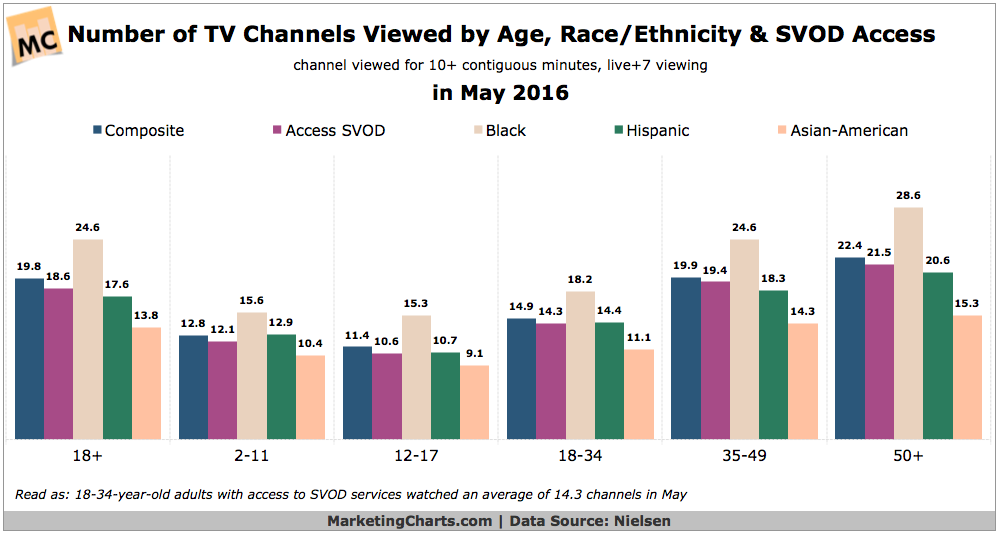
American adults received an average of 206 channels during the month of May, but watched less than 10% of those for roughly 20 channels viewed.
Read More