Email Metrics
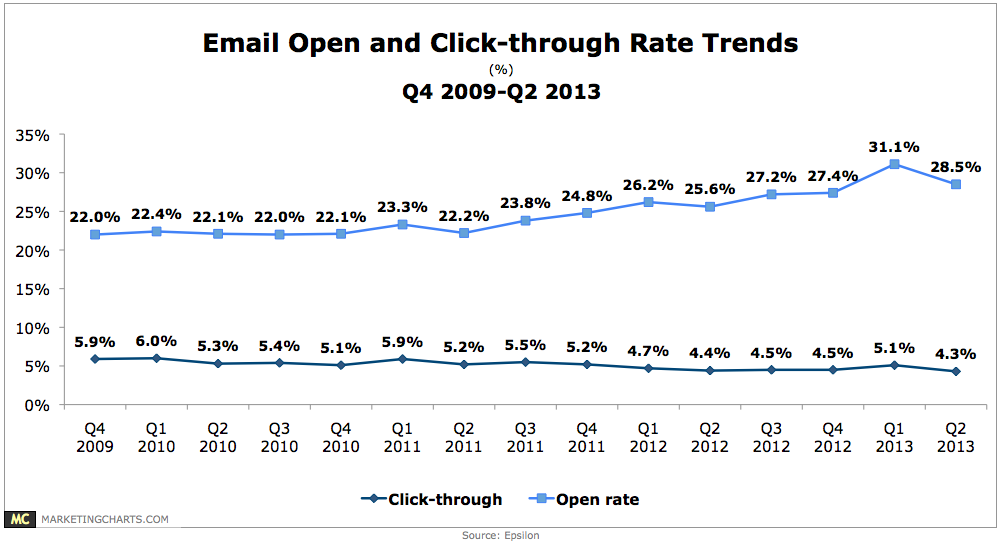
Email Open & Click-Through Rate Trends, Q4 2009 – Q2 2013 [CHART]
The average business-as-usual (BAU) email open rate in North America fell to 28.8% in Q2 after hitting a multi-quarter peak of 31.1% in Q1.
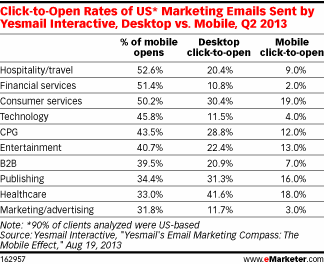
Read MoreMarketing Email Click-To-Open Rates By Industry & Platform, Q2 2013 [TABLE]
While readers clicked on 23% of emails opened on desktop in Q2 2013 in the US, only 11% did so for emails on mobile.
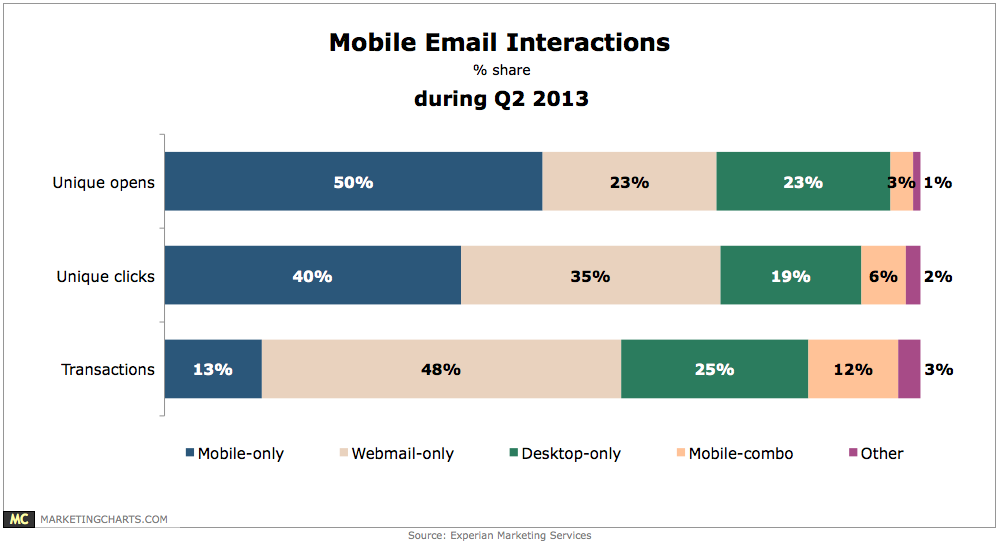
Read MoreMobile Email Interactions, Q2 2013 [CHART]
Fully half of email opens during Q2 occurred only on a mobile device.
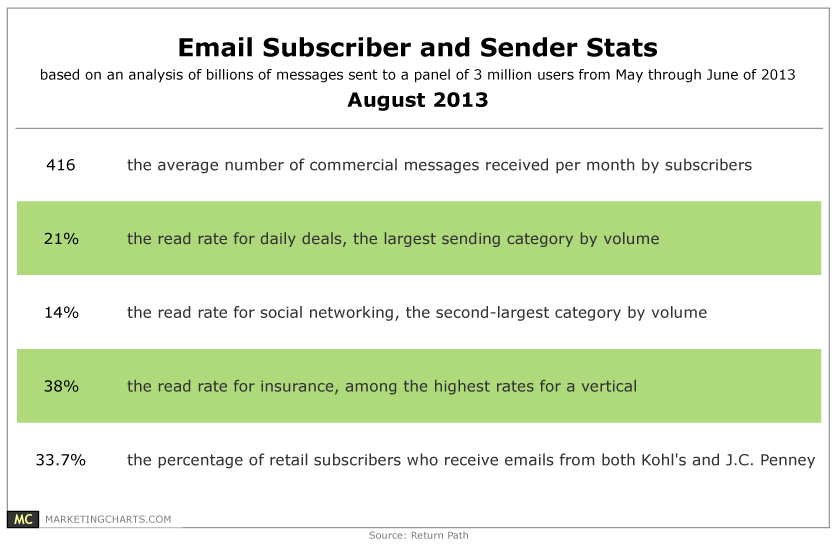
Read MoreEmail Subscriber & Sender Stats, August 2013 [TABLE]
The average subscriber receives 416 commercial emails per month, per new figures released by Return Path.
Read MoreEmail Open Rate By Hour Scheduled, August 2013 [CHART]
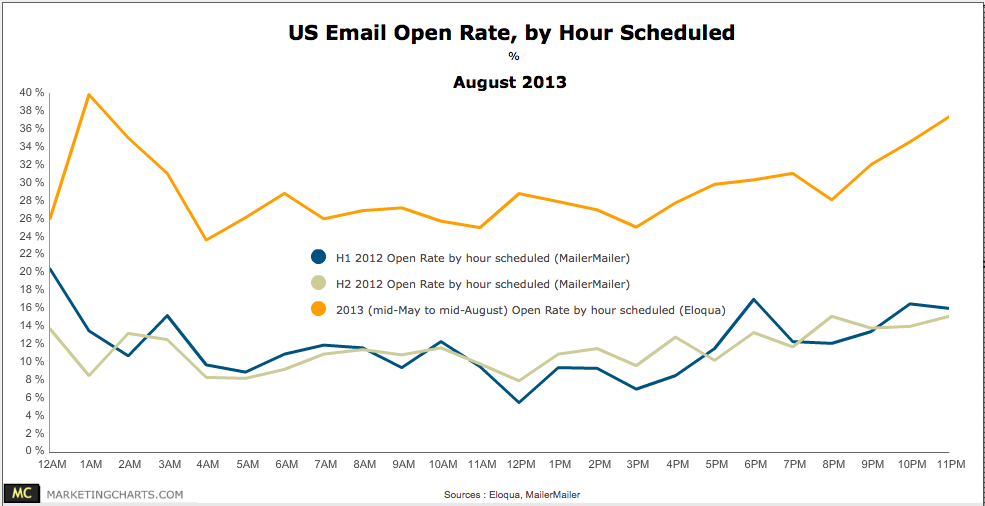
MailerMailer recently published the results of its annual analysis of email marketing metrics, with a section devoted to open and click rates by hour scheduled as well as by day of the week.
Read MoreEmail Click Frequency By Gender, August 2013 [CHART]
Consumers open emails throughout the day, but only click through those emails at specific preferred times, and those windows are often short.
Read MoreEmail Click-to-Open Rates By Industry, Q2 2012 [CHART]
49% of email opens happen on a mobile device.
Read MoreActive Email Subscriber Rates By Industry, Q2 2013 [CHART]
B2B email databases had a subscriber activity rate of just 1.5% (referring to the percentage who opened an email in the last 90 days).
Read MoreCumulative Shelf Life Of An Email Campaign, 2012 [CHART]
Recent data from MailerMailer suggests that opens peak at one hour post-delivery (11.1% of an email’s total opens), falling off quickly during each following hour.
Read MoreGmail Tabs Open Rates By Email Service, August 2013 [TABLE]
Open rates may have been negatively affected (depending on the research), but value per open may turn out to increase, at least according to one source.
Read More