Email Metrics
Email Engagement By Device Type, December 2014 [CHART]
PCs accounted for 72.2% of overall clicks for the subset of email addresses examined in the study, despite representing a smaller 64.2% of email addresses.
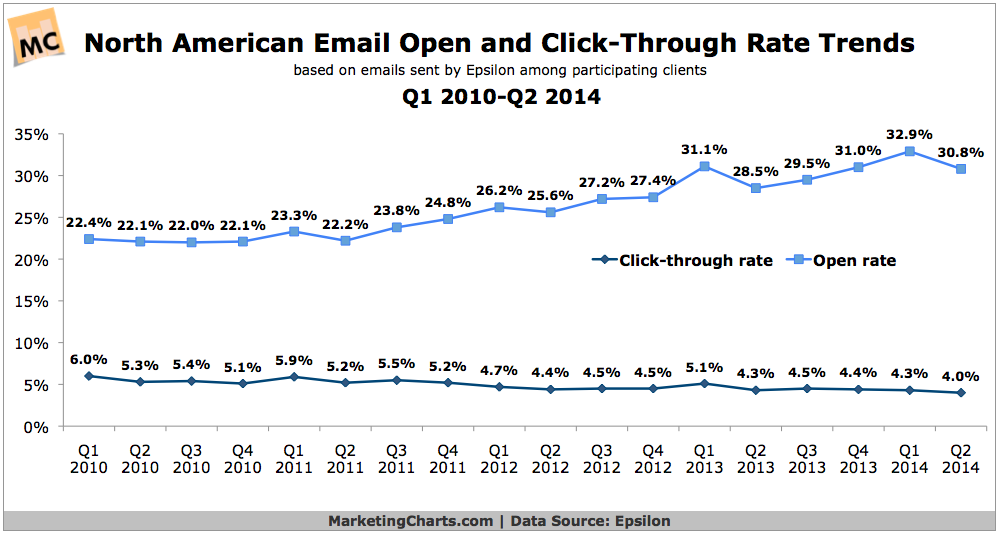
Read MoreEmail Open & Click-Through Rates, 2010-2014 [CHART]
Email open rates declined on a quarter-over-quarter basis in Q2 to 30.8%, although they remain up from the year-earlier period (28.5%).
Read MoreEmail Open & Click Rates By Subject Line Length, 2013 [CHART]
Email newsletters with short subject lines of between 4-15 characters sported the best open rates last year.
Read MoreMarketing Email Tips [INFOGRAPHIC]
This infographic from Quick Sprout illustrates some optimal marketing email tips.
Read MoreGmail Tab Delivery & Read Rates By Industry [CHART]
Gmail’s tabbed inbox seems to be having a positive influence on promotional emails’ inbox placement rates.
Read MoreEmail Inbox Placement Rate By Industry [CHART]
Deliverability rates by industry showed not only clear winners and losers, but how inconsistent inbox placement rates are when looking beyond the global average.
Read MoreEmail Inbox Placement Rates, May 2013 – April 2014 [CHART]
September was the most difficult month to reach the inbox, while December and January were the easiest.
Read MoreGlobal Email Inbox Placement Rates [INFOGAPHIC]
83% of permission-based emails worldwide reached the inbox over the past 12 months, with 6% being sent to spam and 11% blocked.
Read MoreEmail Subscriber Activity By Industry, Q2 2014 [CHART]
Yesmail’s analysis of email database subscriber behavior during Q2 shows that just 1.3% of B2B email subscribers were active, the lowest proportion of the industries studied.
Read MoreEmail Click-to-Open Rates By Industry & Device, Q2 2014 [CHART]
Mobile devices accounted for 64.5% of all email opens during the second quarter of this year.
Read More