Email Marketing
North American Email Marketing Metrics By Daypart, Q4 2012 [TABLE]
Emails sent between 8 pm and 12 am generated higher open and click-through rates, more transactions, larger orders, and greater revenue per email than emails sent during any other time of day.
Read More
Email Personalization Metrics, March 2013 [CHART]
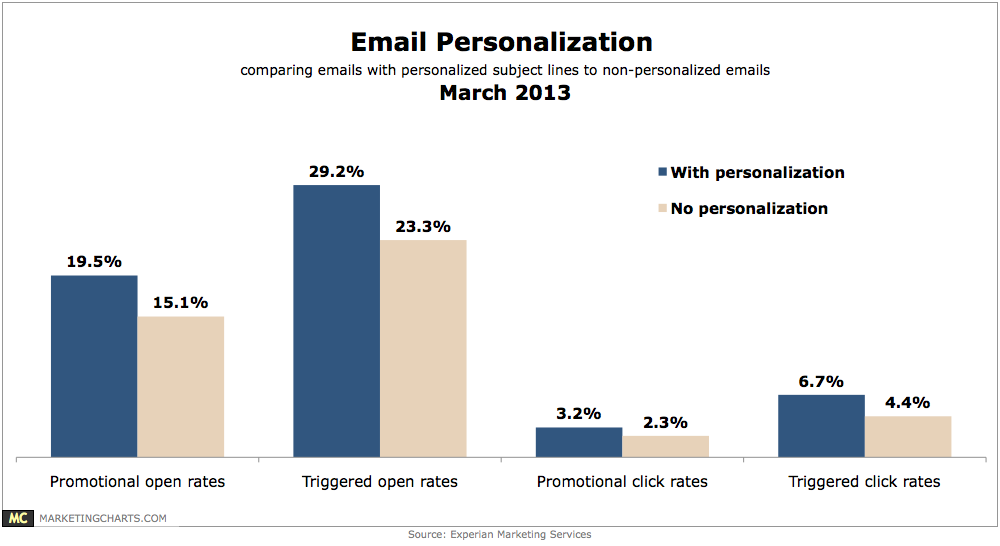
For promotional mailings, emails with personalized subject lines had an average open rate of 19.5%, compared to 15.1% for those without personalization.
Read MoreTop Prompts For Trying New Fashion Retailers, March 2013 [CHART]
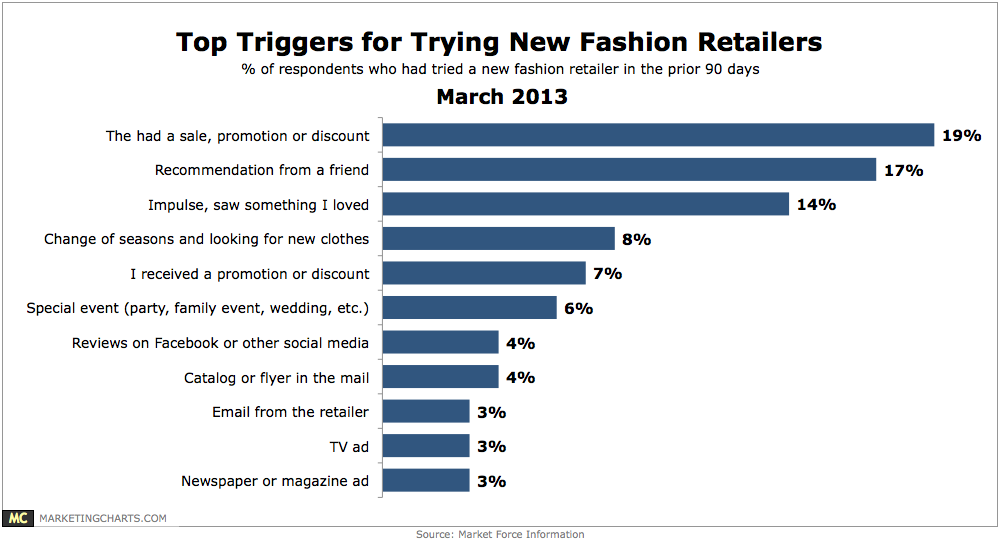
39% said they had tried out a new retailer in the previous 90 days, up 22% from 2011, and almost triple the 14% from 2010.
Read MoreTop Reasons For Unsubscribing From Emails, March 2013 [CHART]
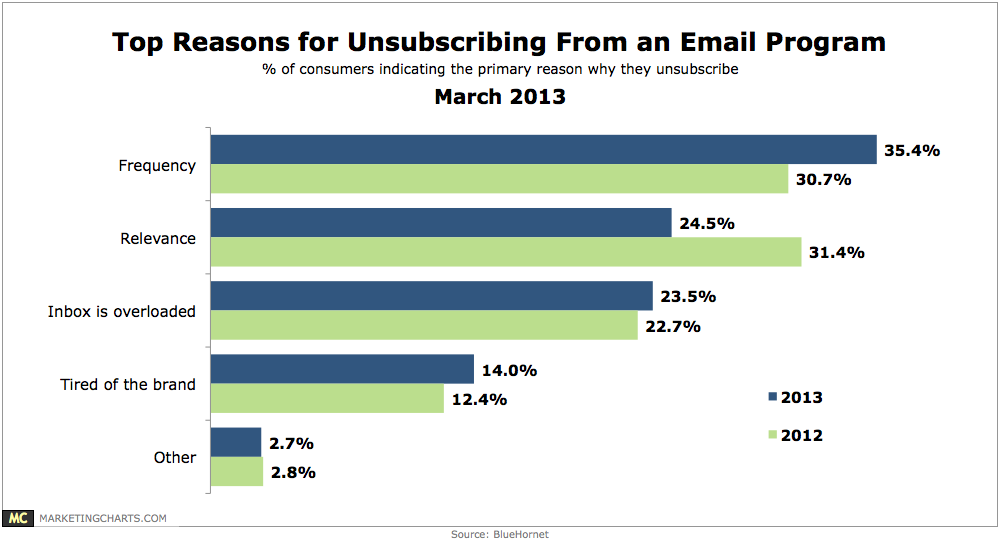
Last year, relevance (31.4%) and frequency (30.4%) almost equally shared the dubious honor of being the chief reason for unsubscribes. But this year, frequency (35.4%) is clearly the top reason.
Read MoreMeasuring ROI For Online Marketing Channels, January 2013 [TABLE]
In January 2013, the greatest percentage of companies reported a good ability to measure the ROI of paid search.
Read MoreMillennials' Cross-Channel Behavior, March 2013 [CHART]
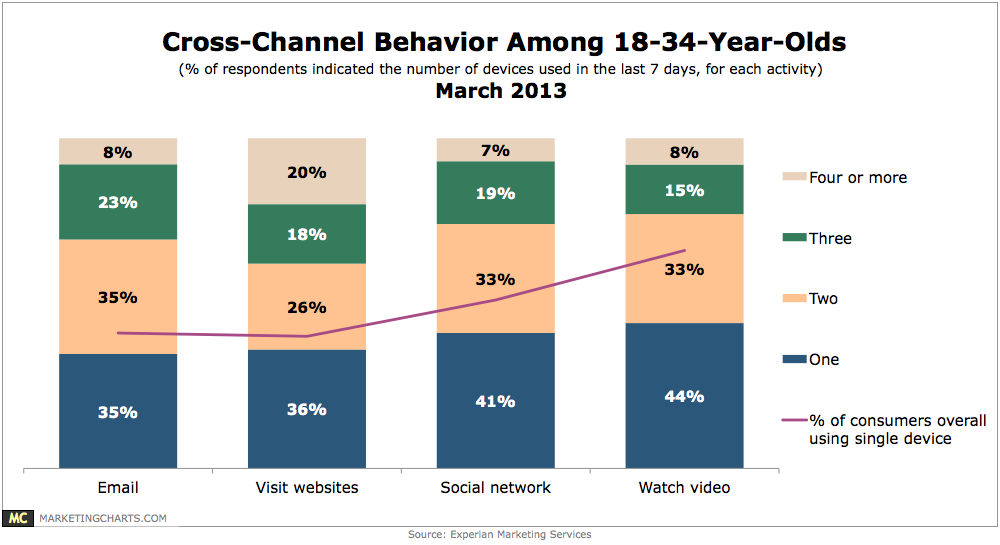
59% of consumers surveyed used more than one device to email in the 7 days prior to the survey and 60% used multiple devices to visit websites.
Read MoreConsumer Reactions To Unoptimized Mobile Email, March 2013 [CHART]
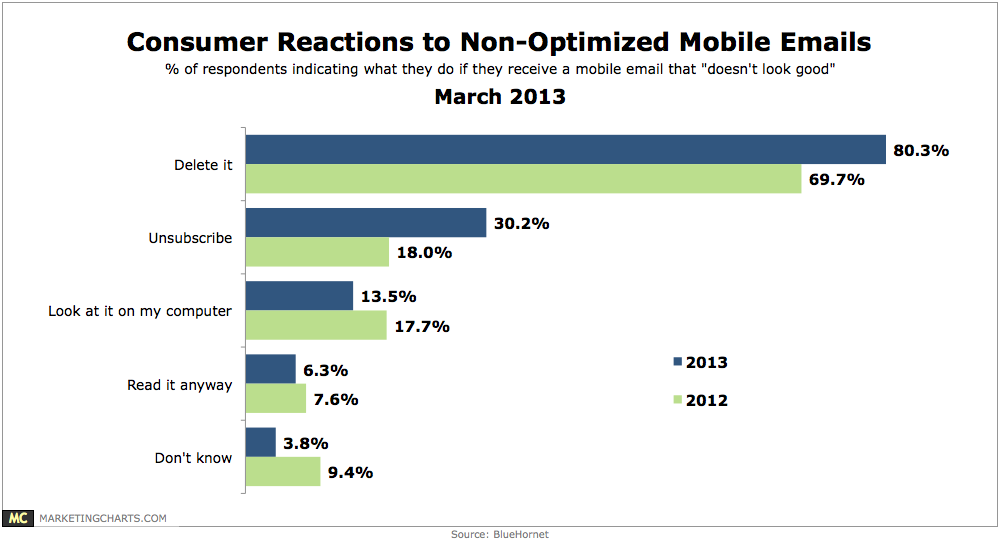
43% of consumers say they read emails most often on a smart phone (36.4%) or tablet (6.9%) as opposed to a desktop or laptop computer.
Read MoreUS Local Online Ad Spending By Media & Format, 2012 [TABLE]
The pace of increase helped expand digital radio advertising’s share of total local digital ad dollars by one-fifth of a percentage point, to 2% of the total.
Read More