eCommerce
eCommerce Landscape [INFOGRAPHIC]
This infographic from LUMA Partners illustrates today’s complex eCommerce landscape.
Read MoreUS Proximity Mobile Payment Transaction Value, 2011-2016 [CHART]
eMarketer projects that proximity mobile payments in the US are set to explode, growing from $2.12 billion in 2013 to $62.24 billion in 2016.
Read MoreMobile Wallet Services Used For In-Store Purchases, Q1 2012 & Q4 2012 [CHART]
About one-third of mobile Wi-Fi users had used PayPal during the 30 days preceding the poll, compared with 20% for Amazon and 10% for Google.
Read MoreUS Digital Game Revenues, January 2012 & January 2013 [CHART]
SuperData pegged the digital games market at $960 million at the beginning of this year, up from $691 million in January 2012.
Read MoreRetailers Benefiting From Showrooming, March 2013 [TABLE]
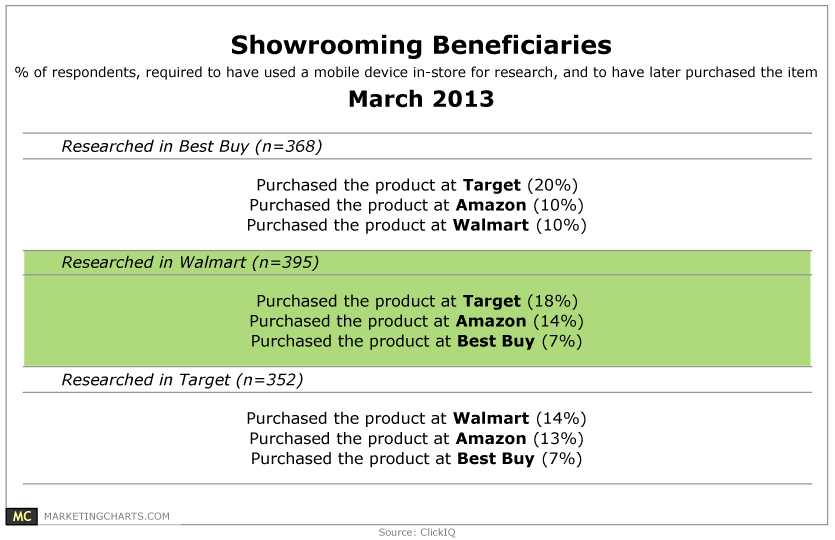
Among those who researched a product while at Best Buy, twice as many ended up purchasing the item at Target (20%) as did at Amazon (10%).
Read MoreMobile Advertising Post-Click Behavior, 2012 [CHART]

16% of advertisers on the Millennial Media platform integrated mobile commerce experiences into their campaigns last year, according to the network’s year-in-review report.
Read MorePrimary Forms Of Payment To Retailers, March 2013 [CHART]
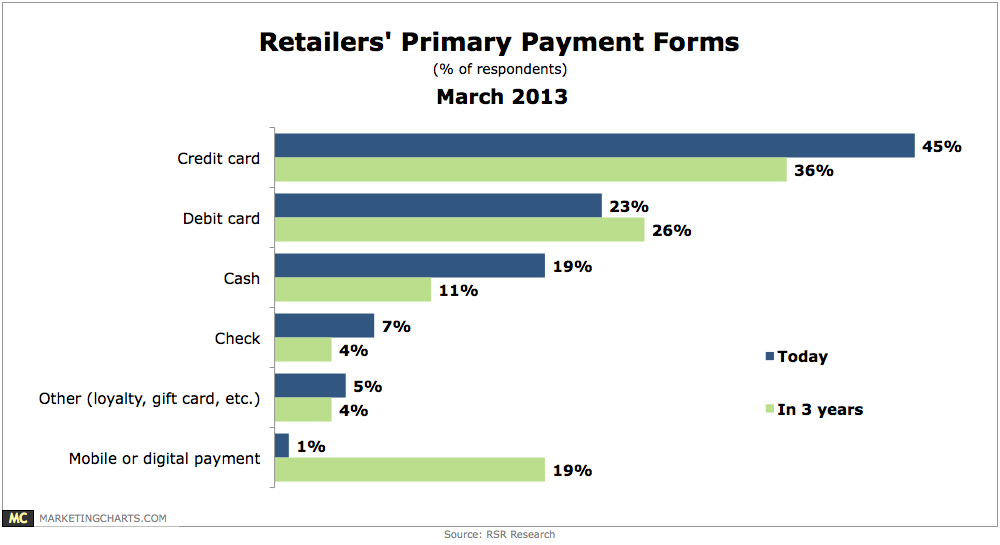
While almost two-thirds of retailers report that credit cards (45%) and cash (19%) are their primary payment forms today, less than half believe that will be the case in 3 years.
Read MoreTypes Of Mobile Apps Moms Use To Aid Purchase Decisions, December 2012 [CHART]
60% of moms reported that retailer apps were the most popular apps to help them make purchase decisions.
Read MorePercentage Of Mobile Shopping By Moms, December 2012 [CHART]
Fully 70% of moms reported using their smart phone or tablet to shop.
Read MoreOnline Shopping Metrics By Shopper Segment, Q2 2012 [TABLE]
Even though return purchasers and repeat purchasers accounted for only 8% of site visitors, they generated a disproportionately high 41% of site sales.
Read More