eCommerce
Consumers & Cross-Channel Retail, April 2013 [TABLE]
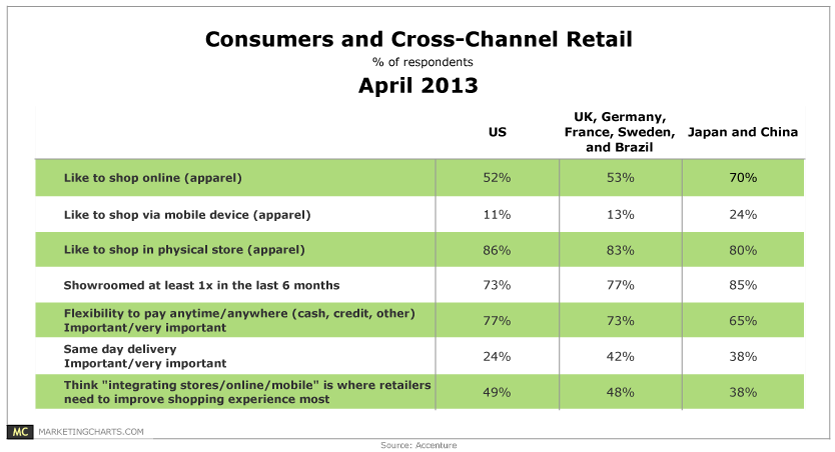
49% of US consumers believe the best thing that retailers can do to improve the shopping experience is to better integrate in-store, online and mobile shopping channels.
Read MoreShare Of Americans' Time Online By Category, 2011 vs 2012 [CHART]
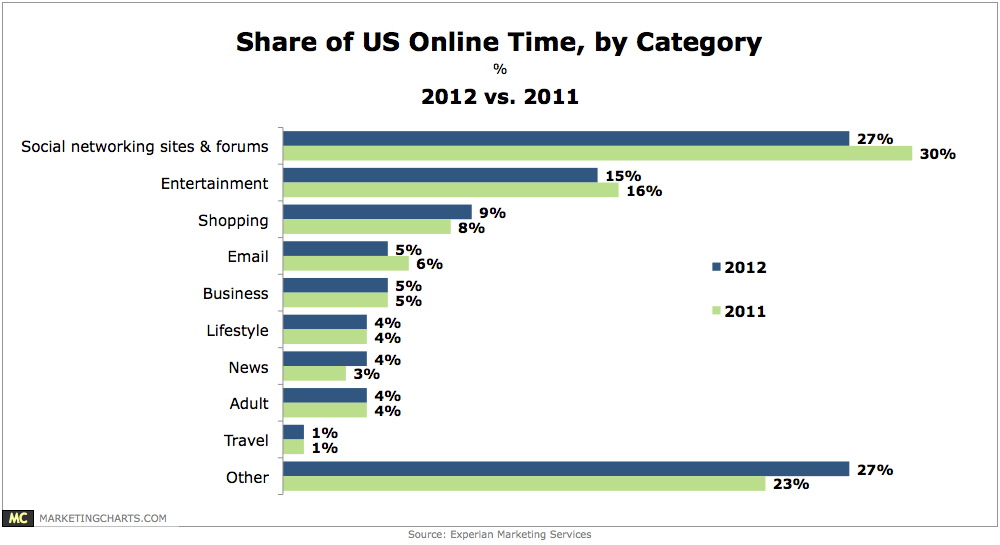
27% of Americans’ time spent online last year was spent accessing social networking sites and forums.
Read MoreRetail mCommerce Revenues, 2012 vs 2013 [CHART]
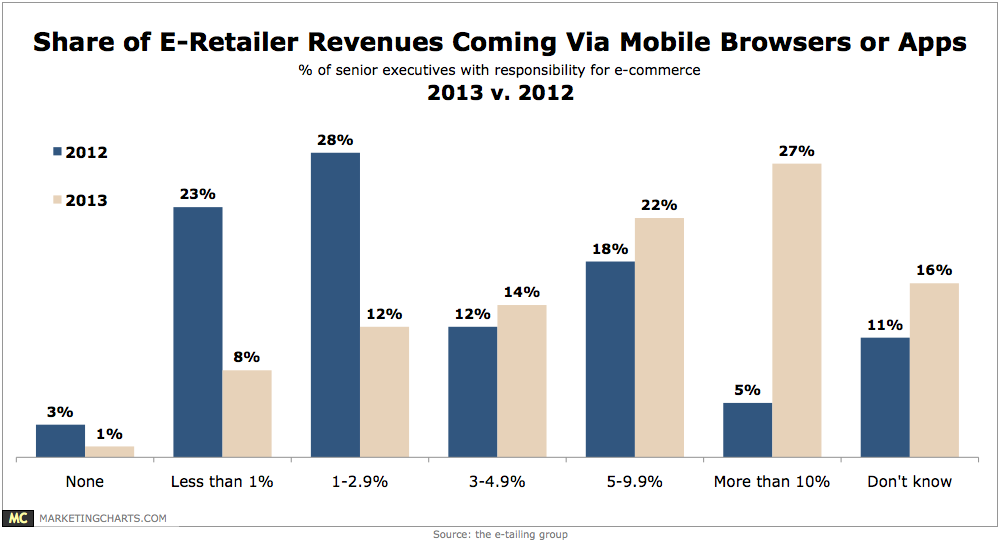
29% of eCommerce executives say that more than 20% of their traffic comes via mobile browsers or mobile applications, a marked increase from just 3% who reported that level of traffic last year.
Read MoreCPG Mobile Advertising Post-Click Actions, 2012 [CHART]
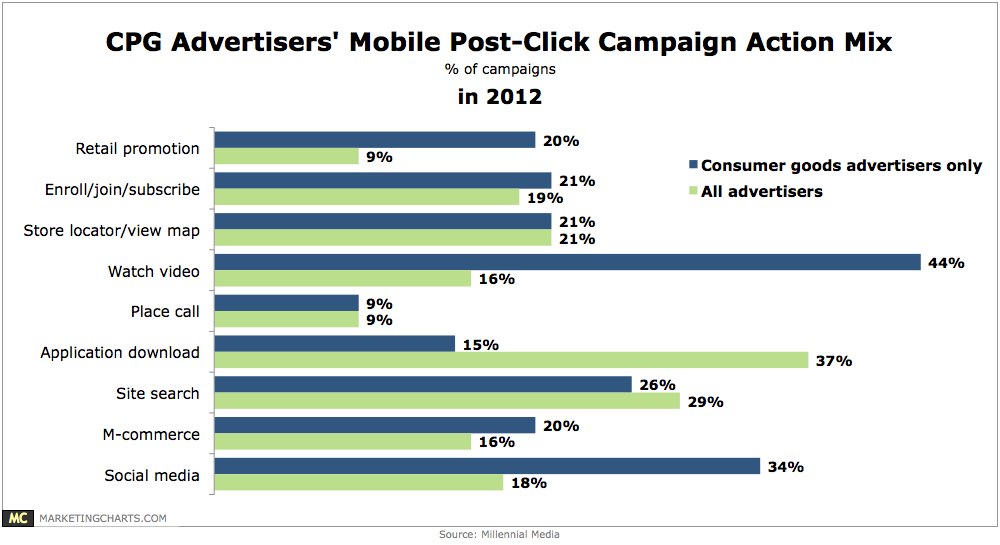
CPG brands were more focused on encouraging consumers to watch video, with 44% of the campaigns incorporating a video aspect (compared to 16% on average).
Read MoreMobile Commerce App Usage By OS, April 2013 [CHART]
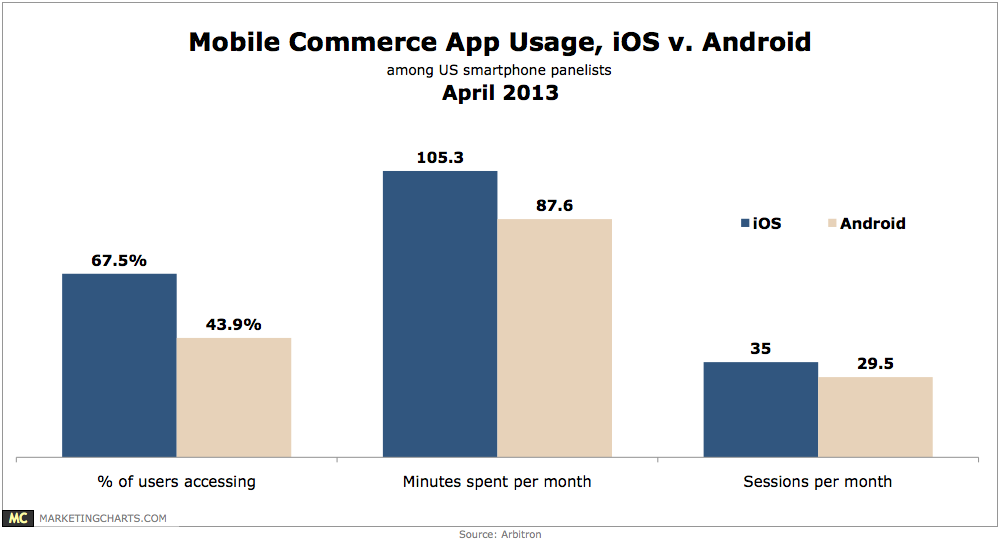
iPhone owners are 54% more likely than Android owners to use mobile applications for commerce.
Read MoreRetailers’ Mobile Price Comparison Policies, April 2013 [CHART]
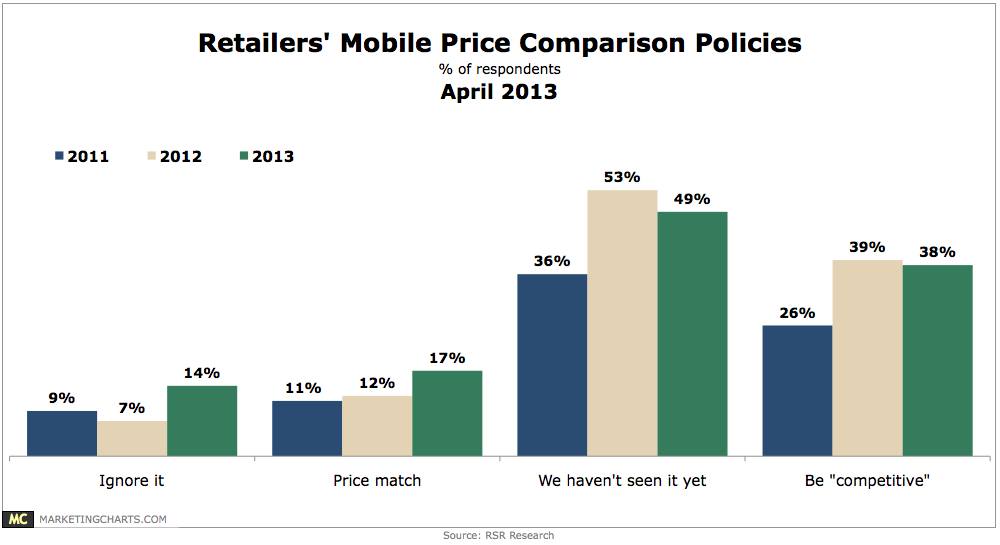
A greater proportion of retailers are choosing to either ignore showrooming practices or price match, although the predominant way of dealing with showrooming remains simply aiming to stay competitive.
Read MoreAd Awareness By Generation & Context, April 2013 [CHART]
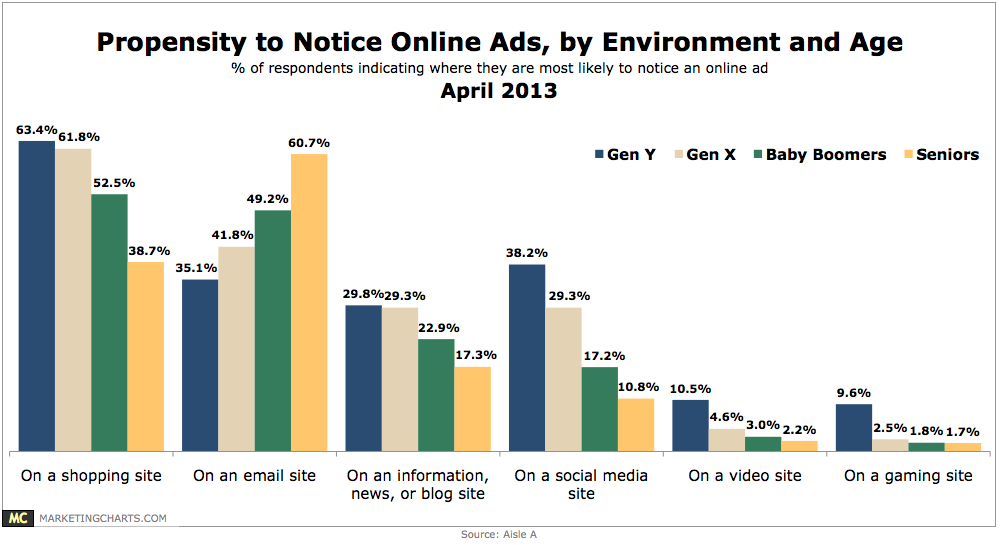
About half of consumers often (18.2%) or sometimes (33%) pay attention to online ads.
Read MoreMobile Payment Adoption, April 2013 [CHART]
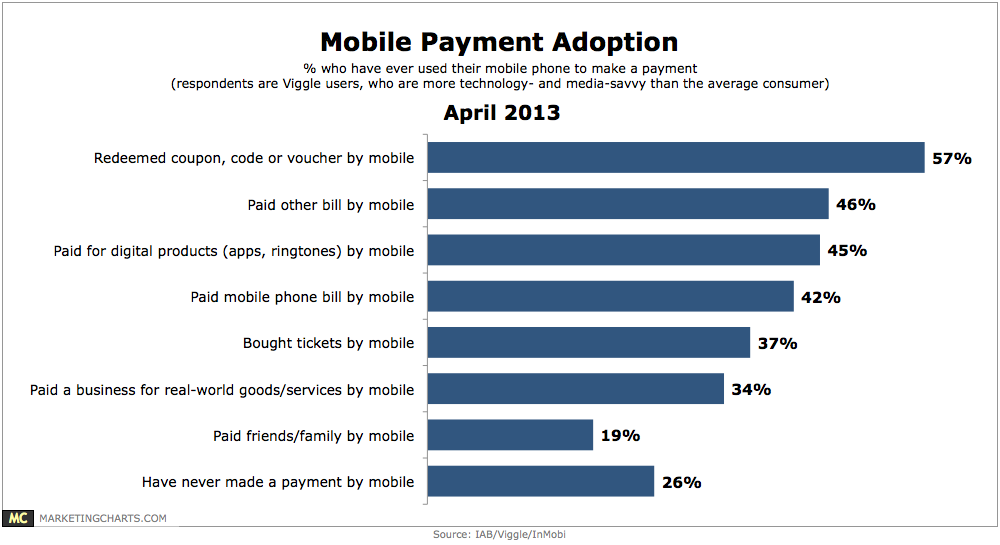
57% of tech-savvy respondents have redeemed a coupon, code or voucher by mobile, while more than 4 in 10 have paid for digital products via their device.
Read MoreWhy American Women Use Mobile For Shopping, March 2013 [CHART]
Just over a majority of American women said they used their mobile device to find store locations and hours.
Read MoreSecond Screen TV-Related Behavior, April 2013 [CHART]
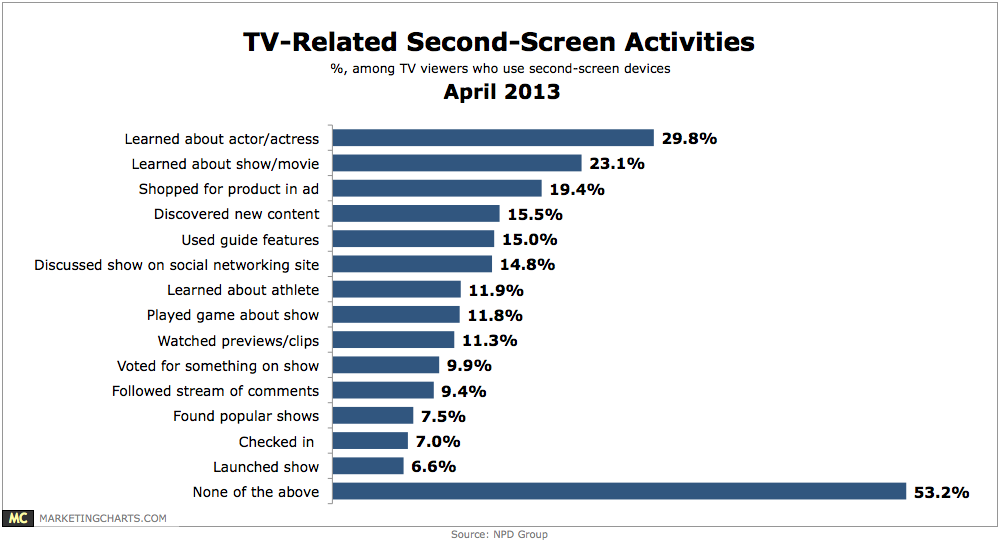
Among the most common is shopping for a product seen in an ad, by 19.4% of TV watchers who engage in second-screen activities.
Read More