eCommerce
Global Mobile Payment Transactions By Device, June 2012 vs April 2013 [CHART]
Europe sports the world’s largest percentage of transactions made using a mobile device, at 15.3%, followed by Asia (12.4%) and North America (11.2%).
Read MoreAffluent Shoppers' Preferred Purchase Channels By Demographic, April 2013 [CHART]
The store still won out as the most common place to make a purchase among affluent consumers, cited by 78% of respondents.
Read MoremCommerce Activities Of Affluent Americans By Device, April 2013 [TABLE]
Among US internet users ages 21 and older earning more than $150,000, more than eight in 10 owned a smart phone, while 56% reported owning a tablet.
Read MoreB2B Procurers' Online Shopping By Age, June 2013 [CHART]
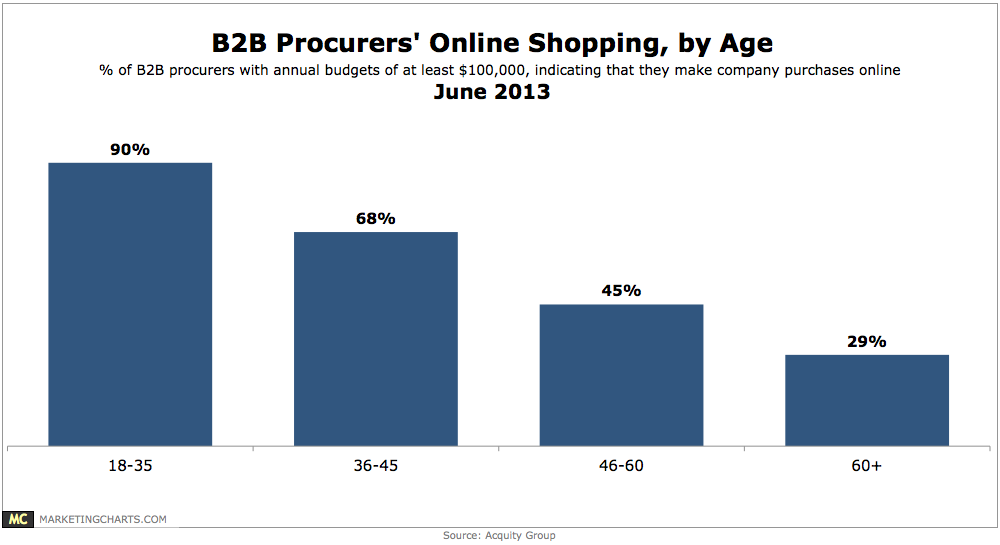
Millennial B2B buyers are far more likely than their older counterparts to make online purchases.
Read MoreProducts Researched & Purchased On A Tablet, March 2012 [TABLE]
A survey from the Online Publishers Association compared product research with product purchase by category among tablet users in March 2013.
Read MoreUS Mobile Shoppers Who Use Tablets, 2011-2017 [TABLE]
In 2011, there were 23.2 million US mobile shoppers using tablets.
Read MoreAttention Online Shoppers Pay To Retailers’ Facebook Updates, June 2013 [CHART]
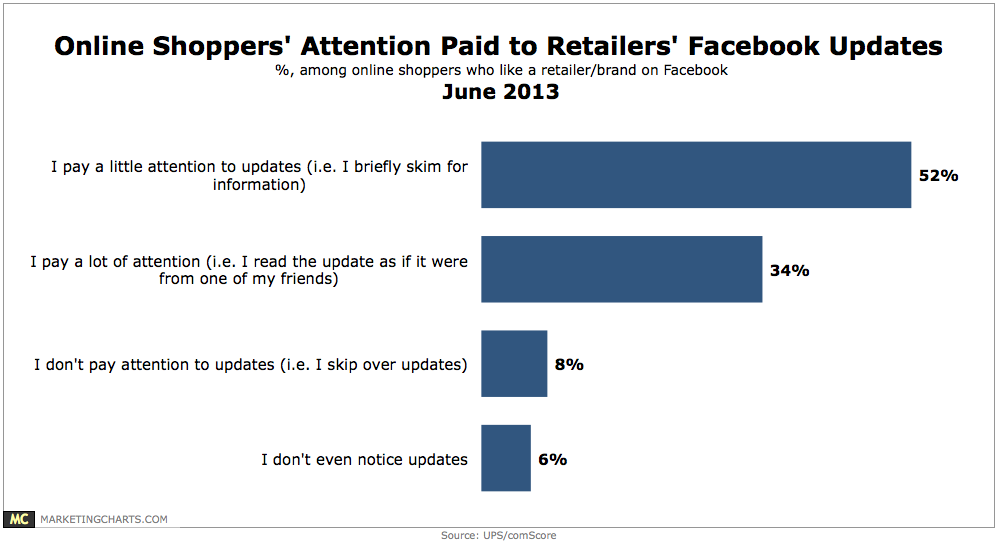
Just 14% of respondents either skip over retailers’ updates (8%) or claim to not notice them at all (6%).
Read MoreAmerican Digital Media Buying Penetration By Generation, 2013 & 2017 [CHART]
95.2% of US millennial adults are estimated to be mobile phone users by the end of the year.
Read MoreInfluence Of Shipping Costs On Online Shoppers, June 2013 [TABLE]
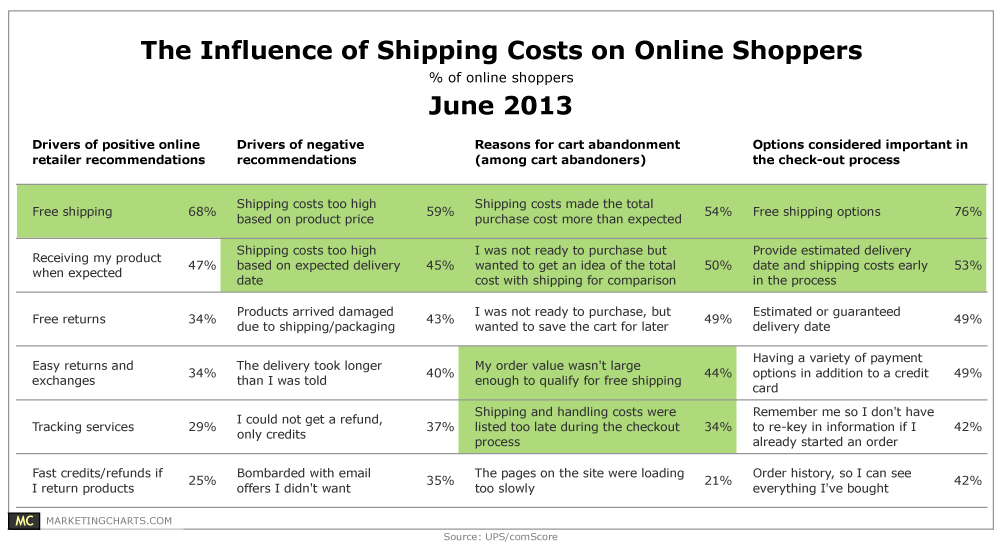
When asked their top drivers of positive recommendations for an online retailer, a leading 68% of respondents cited free shipping, easily the top answer.
Read MoreAmazon's Position In Consumer Electronics Purchase Path, June 2013 [CHART]

When consumers visited a retail site online, 1 in 3 went to Amazon.
Read More