eCommerce
Restaurant Mobile Advertising Tactics, Q1 2013 [CHART]
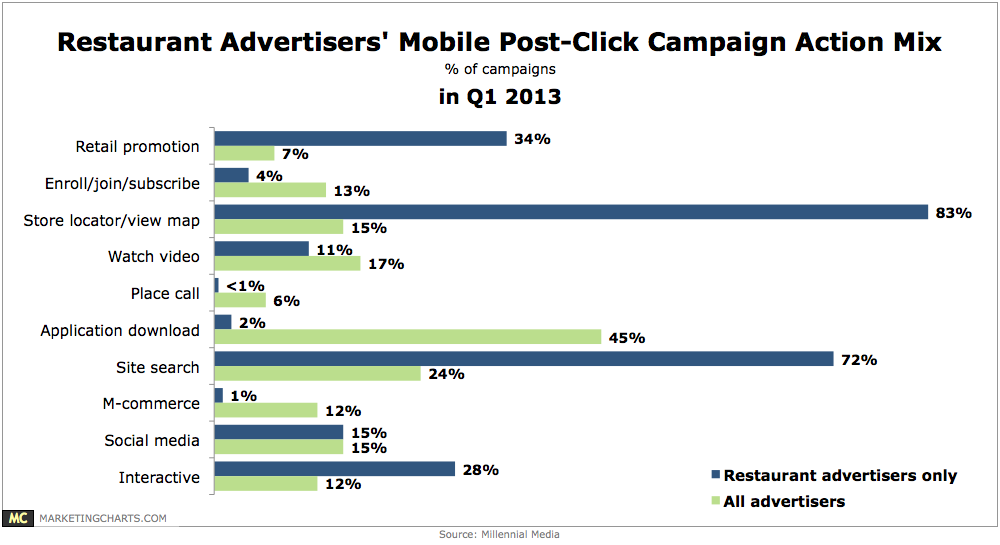
Restaurants’ mobile advertising campaigns are overwhelmingly focused on driving foot traffic, reveals Millennial Media.
Read MoreDaily Deal Purchase Frequency, March 2013 [CHART]
38.2% of US internet users subscribed to at least one daily deal in March 2013, down from 45.3% in September 2011.
Read MoreCollege Students' Multitainment Activities, February 2013 [CHART]
The most popular activity students engaged in while watching TV was using Facebook or Twitter, at 63% of respondents.
Read MoreTop Tech Trends Affecting Retail, June 2013 [CHART]
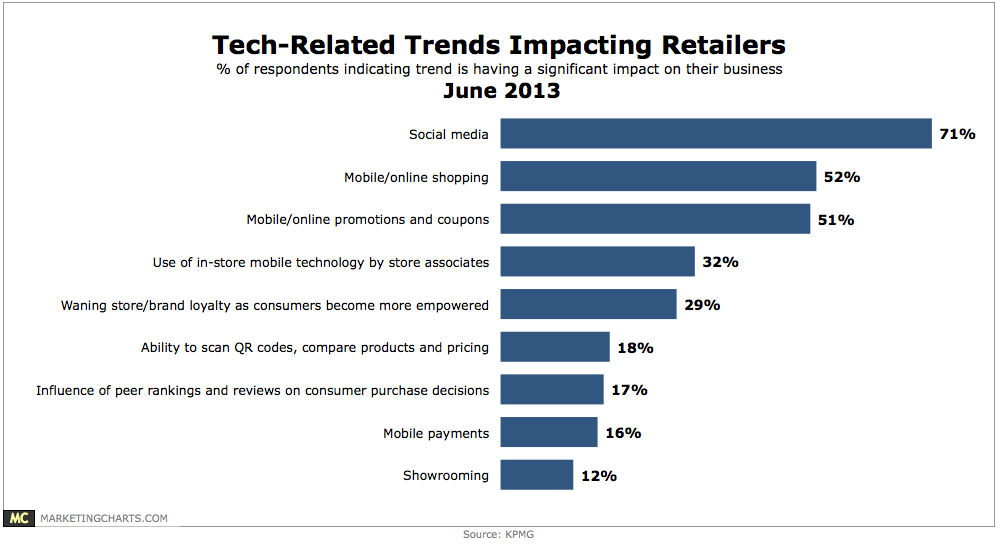
71% of retailers said social media is having a significant impact on their business, with a majority also citing mobile/online shopping (52%).
Read MoreGlobal Online Shopping Behavior By Device, Q1 2013 [TABLE]
Three out of five respondents accessed the internet on a mobile phone, and 22% used a tablet.
Read MoreUnderstanding Of Online Customer's Experience, June 2013 [CHART]
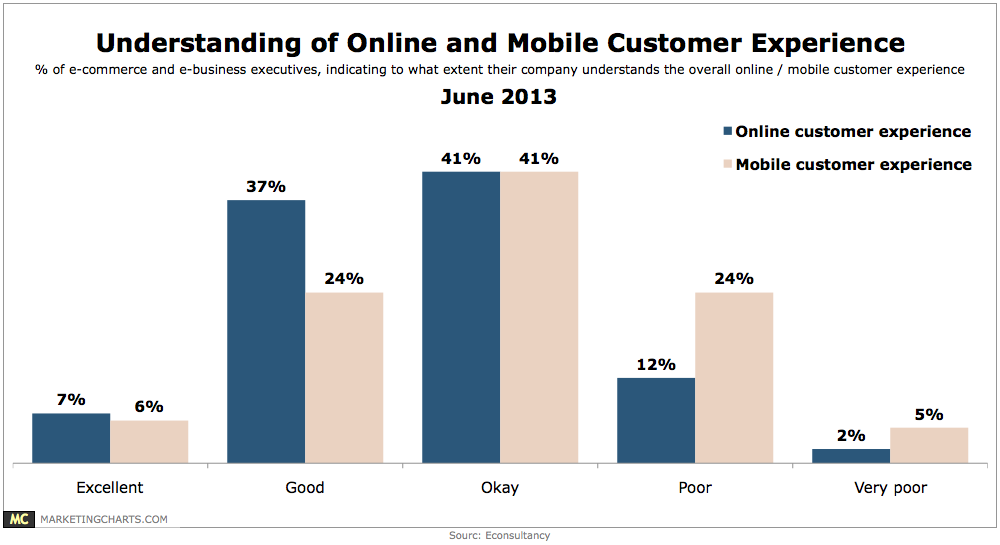
44% of respondents rated their company’s understanding of the online customer experience as either excellent (7%) or good (37%).
Read MoreTop Obstacles To Omnichannel Strategies, June 2013 [CHART]
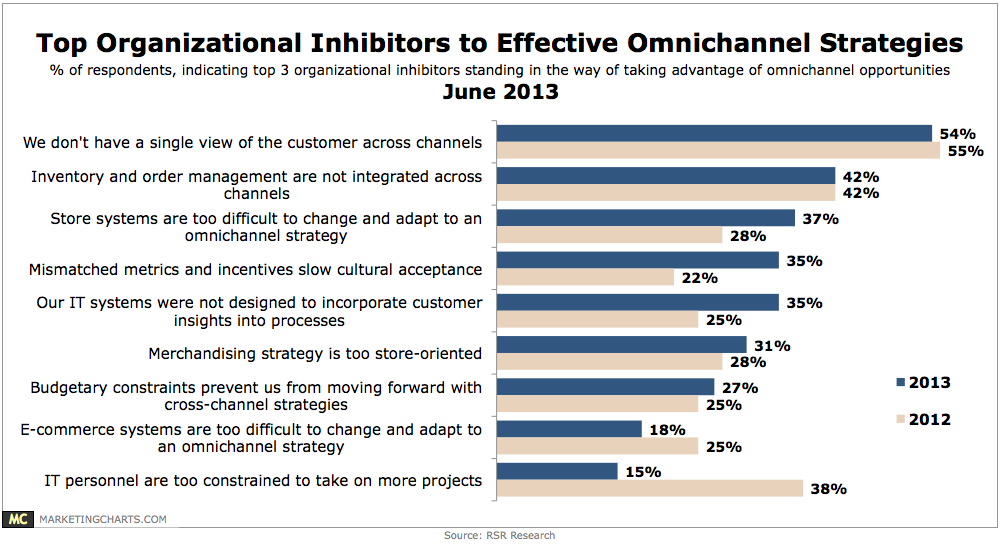
A sizable majority of retailers believe that multi-channel customers are either significantly (47%) or slightly (29%) more profitable than single-channel customers, something consumers themselves appear to agree with.
Read MoreTablet vs. Smart Phone Website Visits For Select Industries, January 2013 [CHART]
Travel not only had the highest percentage of internet traffic coming from tablets at 11.2%, but it was also the only industry studied that actually saw more tablet traffic than smart phone traffic.
Read MoreLGBT Mobile Shopping Activities, June 2013 [CHART]
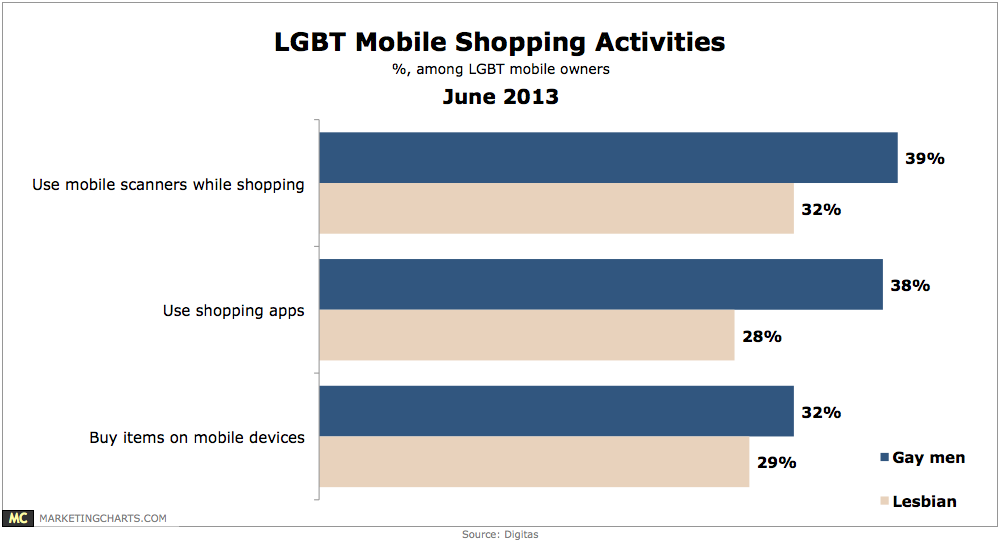
Men are more likely than women to engage in a variety of mobile shopping activities, with gay men more likely to: use mobile scanners while shopping (39% vs. 32%).
Read More