eCommerce
Video Marketing Statistics [INFOGRAPHIC]
This infographic from Renderforest illustrates 47 video marketing statistics to help you think through your video marketing strategy.
Read MoreFacebook Chatbots [INFOGRAPHIC]
This infographic from Headway Capital illustrates five ways small businesses use Facebook chatbots and eight tips for creating one.
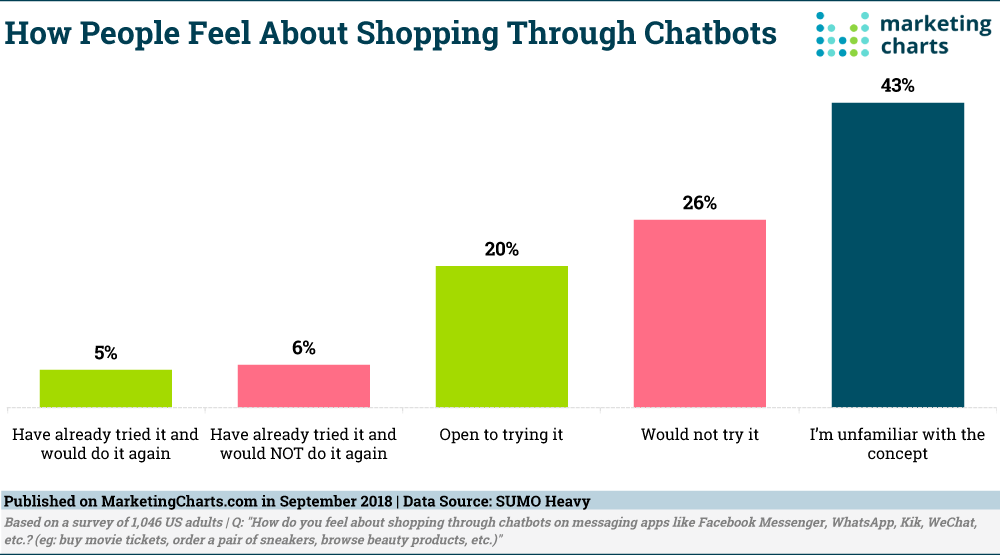
Read MoreConversational Commerce Sentiment [CHART]
Fewer than 1 in 5 adults (18%) have ever purchased something directly on a social media site using features such as a social buy button.
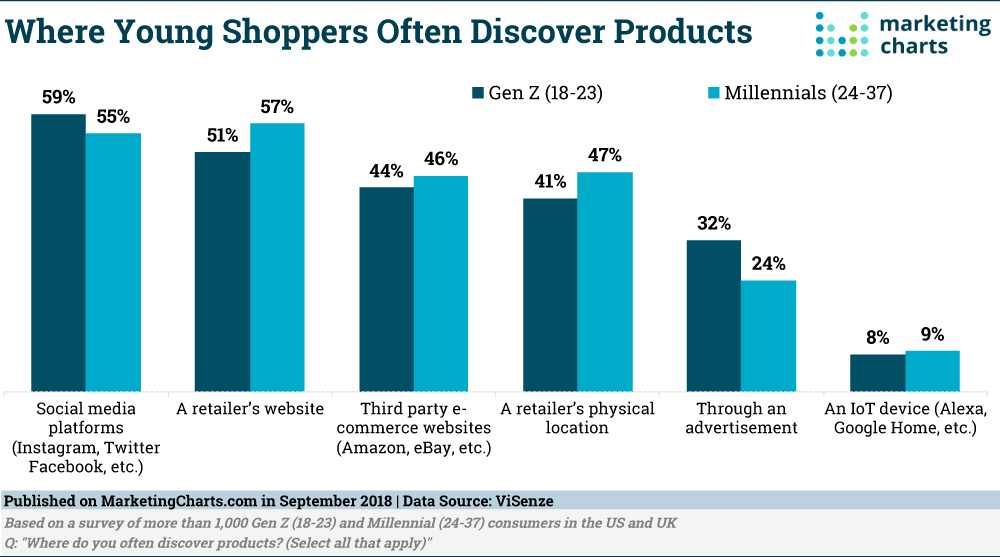
Read MoreWhere Young Shoppers Discover Products [CHART]
Retail marketers continue to focus their energies on Gen Z and Millennial consumers, and doing so should include a healthy level of importance attached to social media.
Read MoreColor Psychology & Conversions [INFOGRAPHIC]
This infographic from Design Advisor illustrates how color choice in online design can effect website conversions.
Read MoreEmail Marketing Statistics for 2019 [INFOGRAPHIC]
This infographic from EveryCloud illustrates 132 email marketing statistics you’ll want to consider as you plan for 2019.
Read MoreSocial Channels That Have A Significant Influence On Shopping [TABLE]
When the first wave of social commerce arrived—mostly reproducing ecommerce catalogs on Facebook—critics predicted it would fail because users didn’t want to shop where they socialized. More than half a decade later, most social media users still don’t turn to social platforms to make direct buys. Now it’s all about influence, social ads and a multi-channel path to purchase.
Read MorePreferred Shopping Method Among Online Buyers [CHART]
The fastest-growing category on Amazon this year is food and beverage, up 40.1%, with the health, personal care and beauty category close behind at 37.9%. While sales volume is still small, the uptick shows consumers are turning to ecommerce more often for everyday items and grocery shopping.
Read MoreGrocery App Users, 2017-2022 [CHART]
Grocery apps are some of the fastest-growing apps in the US. This year, 18.0 million US adults will use a grocery app at least once a month, up 49.6% over last year.
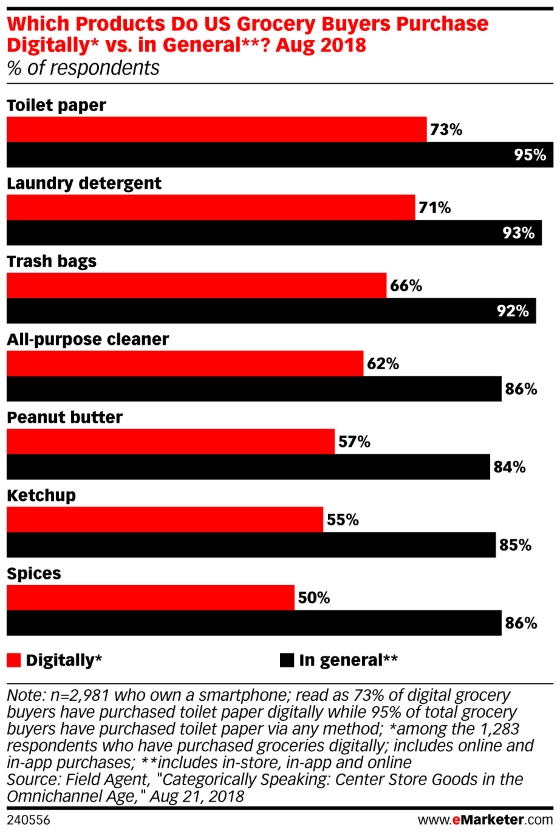
Read MoreWhat Grocery Shoppers Buy Online [CHART]
When asked by Field Agent which categories were easiest to shop for online/in-app, 49% cited center store groceries. Only 5% said meat was easiest to shop for digitally.
Read More


