eCommerce
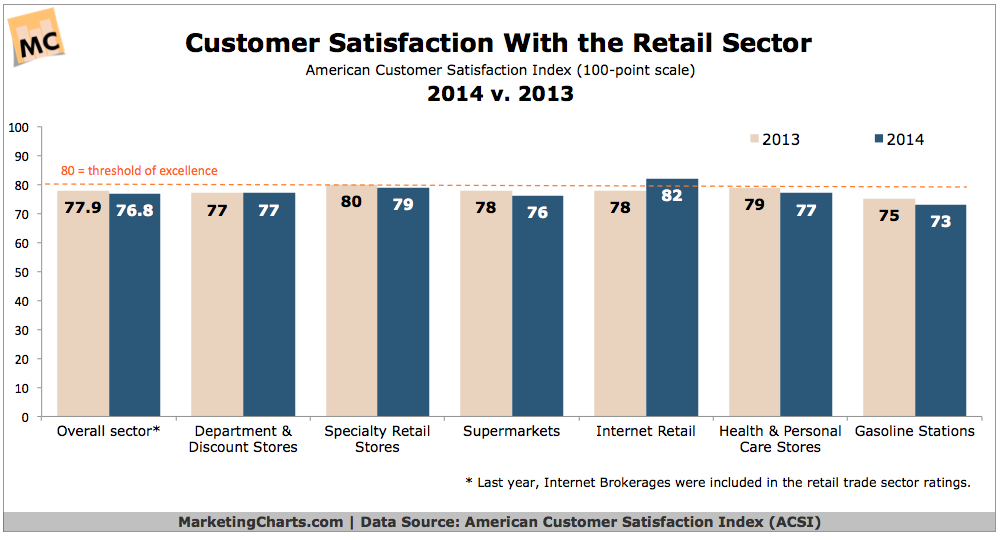
Customer Satisfaction With the Retail, 2013 vs 2014 [CHART]
Customer satisfaction with almost all forms of traditional retail dropped, while satisfaction with online retailers improved.
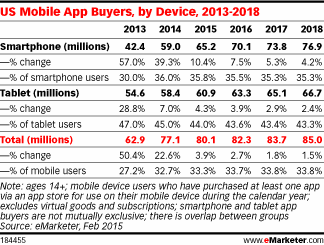
Read MoreUs Mobile App Buyers By Device, 2013-2018 [TABLE]
80.1 million US consumers will pay for mobile apps at least once this year, representing only 33.3% of all mobile users.
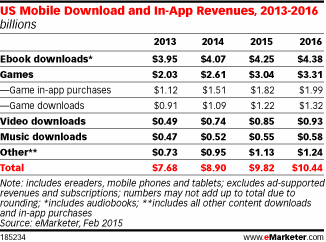
Read MoreMobile Downloads & In-App Revenues, 2013-2016 [TABLE]
Ebook sales will reach $4.25 billion in 2015, accounting for 43.3% of US mobile download and in-app revenues in 2015.
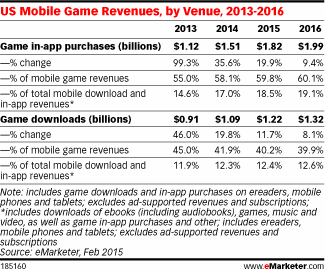
Read MoreMobile Game Revenues By Venue, 2013-2016 [TABLE]
Mobile content revenues in the US will total $9.82 billion in 2015, a 10.3% increase from 2014.
Read MoreMobile Game Revenues, 2013-2016 [CHART]
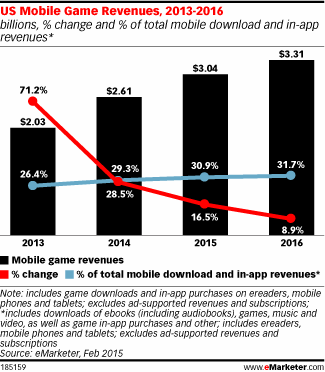
US mobile game revenues—including both downloads and in-app purchases—will grow 16.5% this year to reach $3.04 billion.
Read MoreConsumer Attitudes Toward mCommerce, February 2015 [CHART]
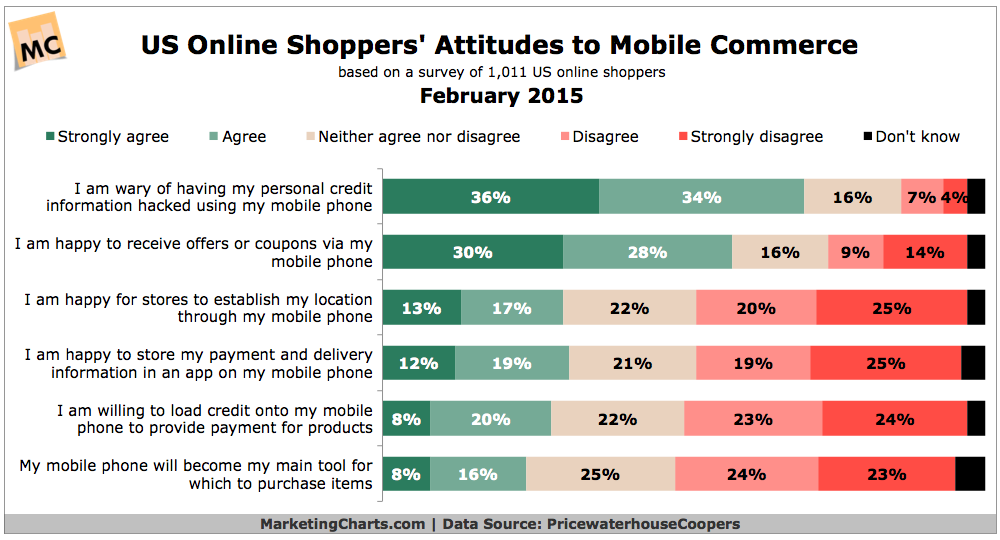
Almost 6 in 10 online shoppers surveyed by PwC agree that they’re happy to receive offers or coupons via their mobile phone.
Read MoreMobile Millennials Expectations For Brands Technology Use, February 2015 [CHART]
Mobile Millennials are more likely to expect brands to have a mobile-friendly website or app than they are to expect brands to have a social media presence.
Read MoreAmount Millennials Spend Via Social Commerce, Fall 2014 [CHART]
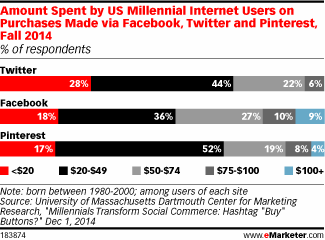
Nearly three-quarters of Millennials spent $49 or less when buying something via Twitter, compared with 54% who said the same about Facebook.
Read MoreTop Ways People Would Use Wearables, December 2014 [CHART]
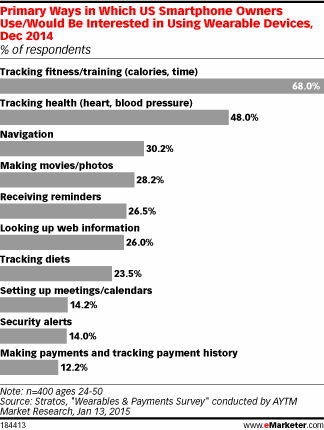
Among the 67.7% of US smartphone owners who didn’t own a wearable, smart wristbands such as Fitbit and Jawbone were of the most interest, cited by 39.4%.
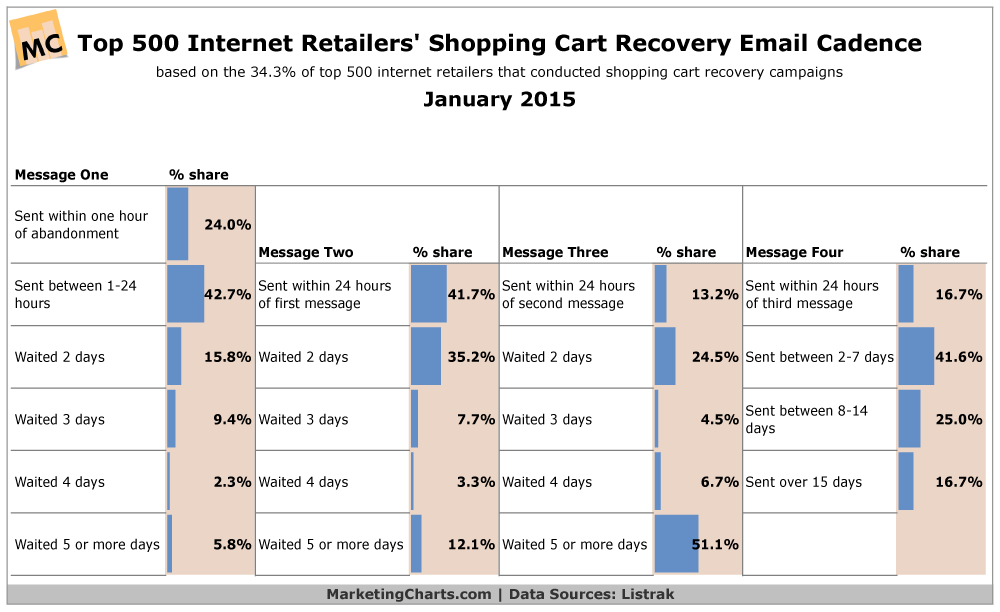
Read MoreTop Retailers’ Shopping Cart Recovery Email Chains, January 2015 [CHART]
Some 34.3% of the Internet Retailer Top 500 send shopping cart recovery emails in 2014, representing a 45.9% increase from a year earlier.
Read More