Display Advertising
Channels In Which B2B vs B2C Marketers Can Prove ROI, November 2014 [CHART]
33% of US B2B & B2C marketing professionals still didn’t know which channel made the biggest impact on revenues.
Read MoreIn-View Online Display & Video Ads, Q4 2014 [CHART]
The percentage of US online video ads that were in-view that quarter reached 39.0%, a 9-percentage-point quarter-over-quarter increase.
Read MoreMarketers' Ability To Measure ROI Of Online Marketing, March 2015 [CHART]
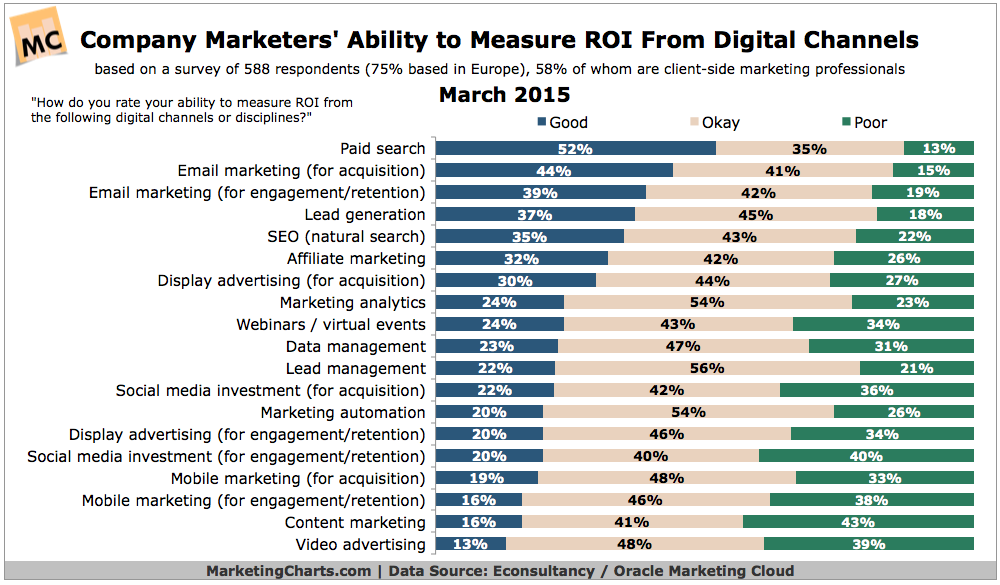
Despite increasing pressures to prove their worth, American CMOs continue to have difficulty quantitatively demonstrating the impact of their activities.
Read MorePrimary B2B & B2C Revenue-Driving Channels, February 2015 [CHART]
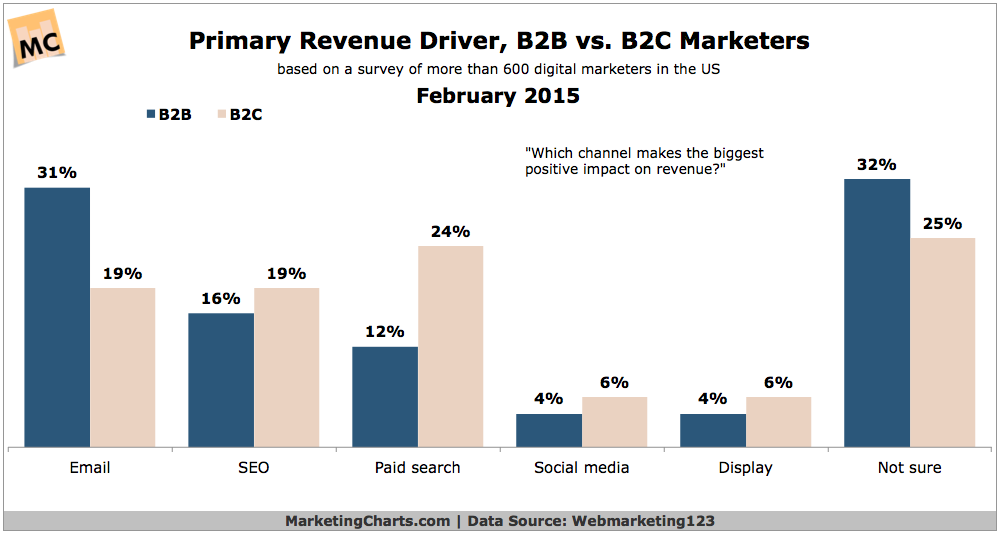
B2B marketers count lead generation as their top marketing objective, while B2C marketers are most heavily focused on driving sales this year.
Read MoreSuper Bowl Advertising Has Jumped The Shark

With rising advertising rates and diminishing returns, can we all agree now that Super Bowl advertising has jumped the shark?
Read MoreUS Social Media Ad Spending By Type, 2014-2019 [CHART]
US native social media ad spending is expected to reach $18.4 billion in 2019, over 240.7% more than the $5.4 billion estimated for 2014.
Read MoreDisplay Ad Viewability Rates By Ad Size, July 2014 [CHART]
Vertical ad units were consistently the most viewable. Worldwide, 120×240 placements performed the best for viewability, with a rate of 55.6%.
Read MoreMobile Display Ad Viewability Metrics By Ad Size, Q3 2014 [TABLE]
Screenwide display ads on mobile were tops for viewability.
Read MoreDesktop Display Ad Viewability & Engagement Metrics By Ad Size, Q3 2014 [TABLE]
970×250 ads had the highest in-view rate out of desktop display ads studied worldwide during Q3 2014, at 65.8%.
Read MoreChange In Ad Spend By Medium, Q1-Q3 2014 [CHART]
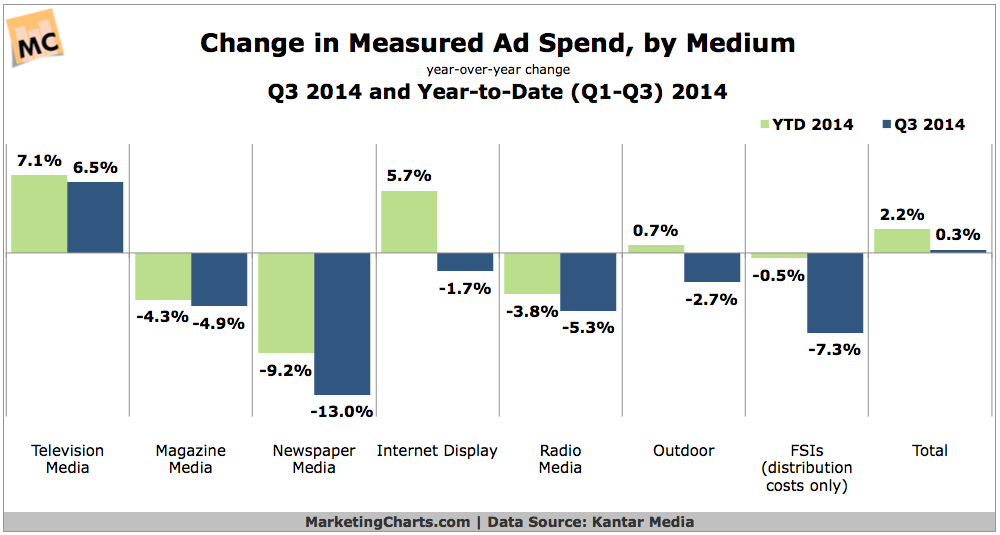
US ad spending grew by just 0.3% year-over-year in the third quarter to reach $33.7 billion, with year-to-date growth slowing to 2.2%.
Read More