Display Advertising
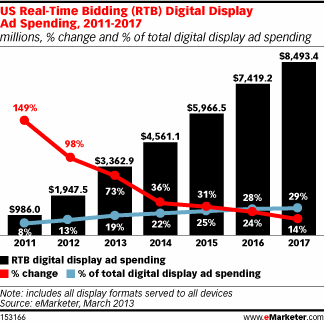
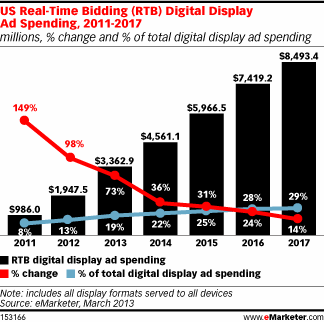
US Real-Time Bidding Display Ad Spending, 2011-2017 [CHART]
eMarketer estimates that total US RTB digital display ad spending will rise by 73% this year, after more than doubling in 2011 and nearly doubling again in 2012.
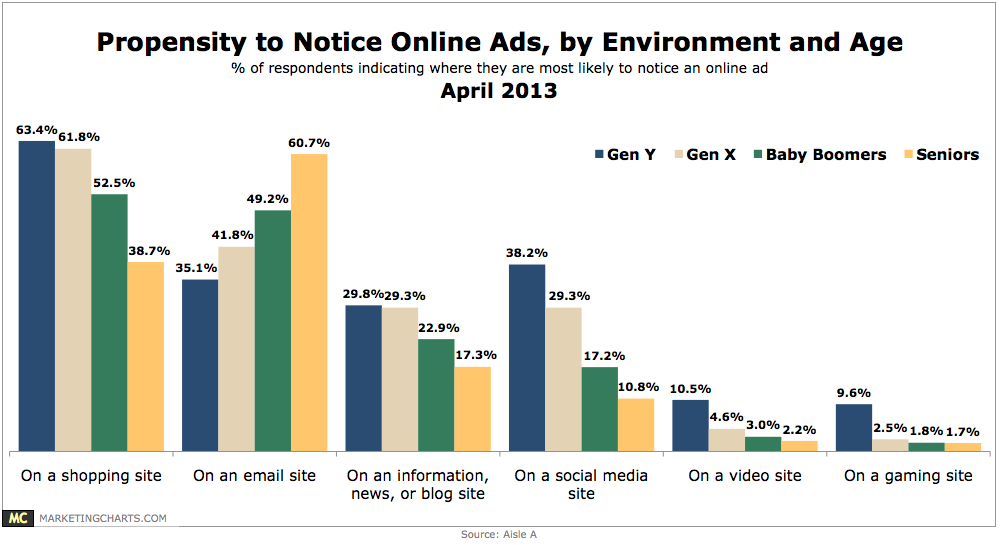
Read MoreAd Awareness By Generation & Context, April 2013 [CHART]
About half of consumers often (18.2%) or sometimes (33%) pay attention to online ads.
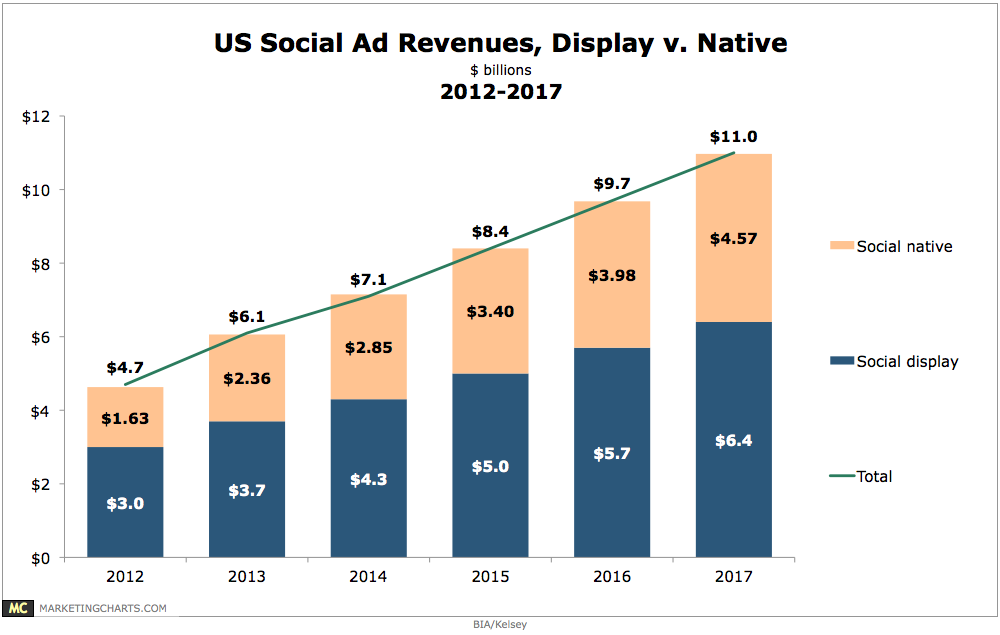
Read MoreUS Display vs Native Social Ad Revenues, 2012-2017 [CHART]
While display will remain the dominant social media advertising unit, native ad formats (such as Twitter’s Promoted Tweets) should grow rapidly over the coming years.
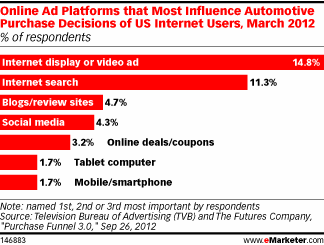
Read MoreMost Influential Ad Platforms For Automotive Purchase Decisions, March 2012 [CHART]
55% of respondents’ digital ad spending went to paid search engine marketing (SEM).
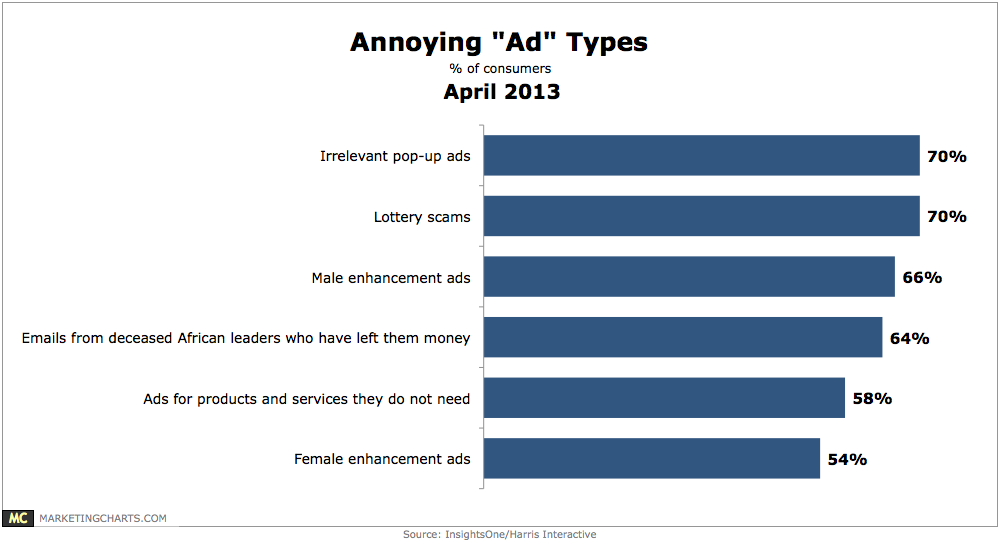
Read MoreAnnoying Ads, April 2013 [CHART]
More Americans are annoyed by irrelevant pop-up ads (70%) than by male (66%) or female (54%) enhancement ads.
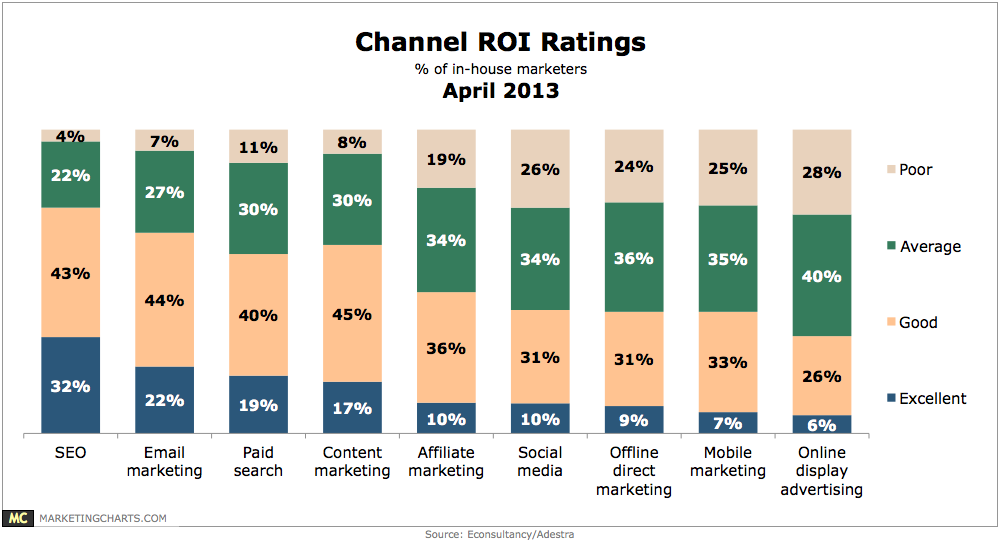
Read MoreChannel ROI Ratings, April 2013 [CHART]
75% of global marketers (primarily from the UK) rate SEO as “excellent” (32%) or “good” (43%) in terms of return on investment.
Read MoreUS Real-Time Bidding Display Ad Spending, 2011-2017 [CHART]
US advertisers will spend more than $3.36 billion on real-time bidding this year, up from just under $2 billion in 2012 and less than $1 billion in 2011.
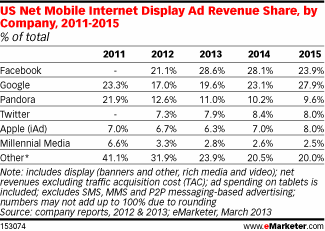
Read MoreUS Net Mobile Display Ad Revenue Share By Company, 2011-2015 [TABLE]
Facebook, the No. 2 mobile ad publisher in the country, accounted for 9.5% of mobile ad revenues in 2012 and is expected to take 13.2% this year.
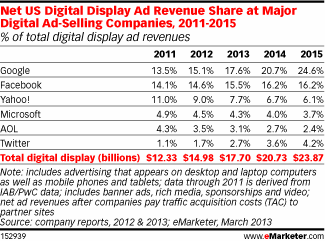
Read MoreUS Online Advertising Revenue Share At Major Ad Networks, 2011-2015 [TABLE]
Yahoo!’s share of net US display ad revenues is expected to decline again this year to 7.7%, down from 9% in 2012 and 11% in 2011.
Read More