Display Advertising
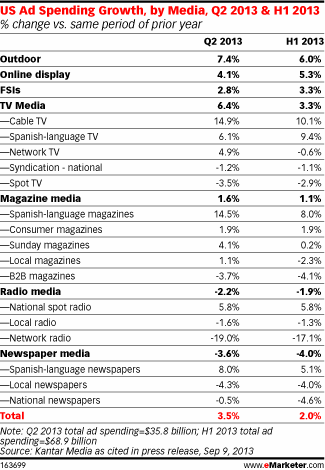
US Ad Spending Growth By Media [CHART]
For the first half of 2013, Kantar Media estimated that the total US ad spend market rose 2.0%, compared with the same period one year earlier.
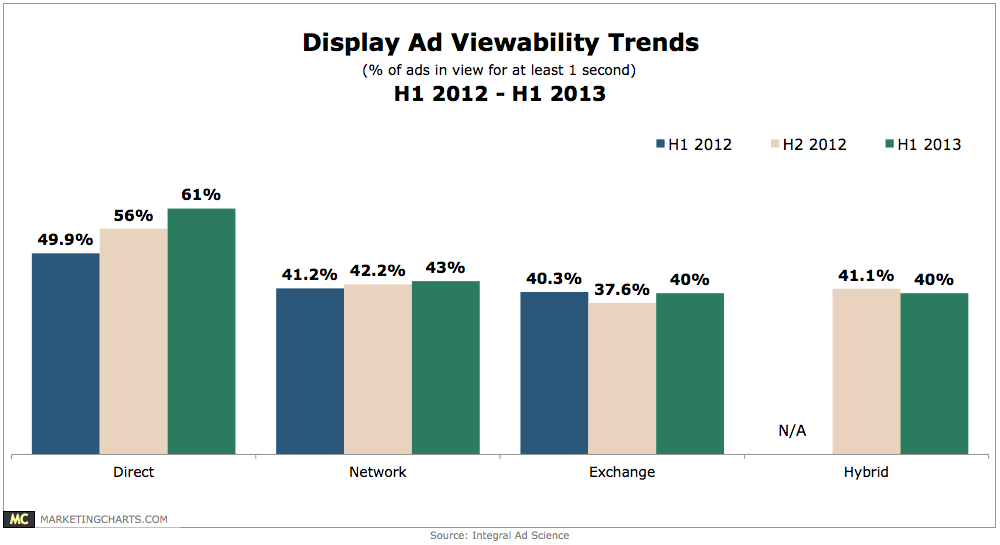
Read MoreDisplay Ad Viewability Trends, H1 2012 – H1 2013 [CHART]
61% of directly placed ads stayed in-view for at least 1 second during the fist half (H1) of 2013, up from 56% in the second half of 2012 and 49.9% in H1 2012.
Read MoreReddit Shuts Down Navy Yard Shooting Subreddit & 9/11 Mistweets – Beyond Social Media Show [VIDEO]
Topics on episode 16 of the Beyond Social Media Show: Reddit shuts down Navy Yard Shooting subreddit; Esquire’s 9/11 tweet gone wrong; Volkswagon’s Take On Me commercial; Dunkin’ Donuts Monday Night Football Vine ad & much more.
Read MoreImportant Tactics For Brand Marketing, April 2013 [CHART]
Online advertising and marketing executives rated search a close second to video as a marketing tactic critical for achieving branding objectives.
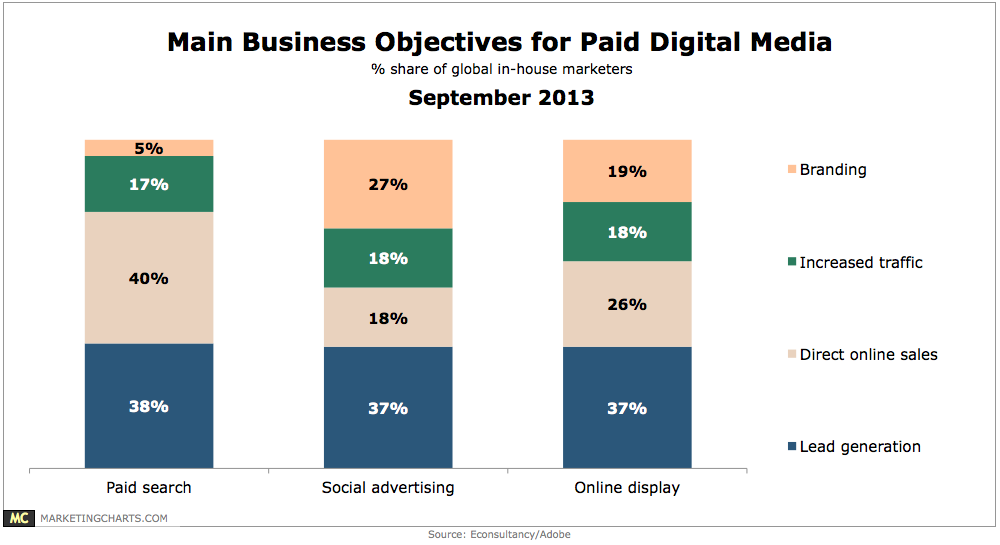
Read MoreTop Business Objectives For Online Advertising, September 2013 [CHART]
More companies cite lead generation (37%) than branding (27%) as their main social media advertising objective.
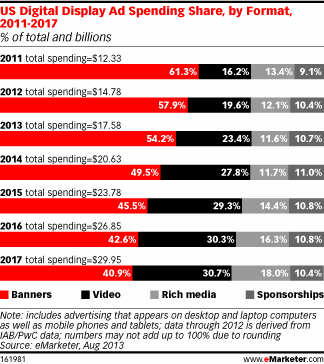
Read MoreUS Online Display Ad Spending Share By Format, 2011-2017 [CHART]
eMarketer estimates that video’s share of the overall digital display budget will rise from 23.4% this year to 30.7% by 2017.
Read MoreUS Mobile Display Ad Spending, 2011-2017 [CHART]
Mobile internet display ad spending will amount to $3.81 billion this year—up 21.7% from 2012.
Read MoreUS Real-Time Bidding Digital Ad Spending, 2012-2017 [CHART]
Marketers will spend $3.34 billion this year on real-time-bidded ads, up 73.9% from last year.
Read MoreUS Digital Ad Spending By Format, 2011-2017 [TABLE]
This year, 21.7% of all digital display ad spending will be on mobile, rising to 48.4% by 2017.
Read MoreUS Mobile Ad Spending By Format, 2011-2017 [TABLE]
In 2010, just 2.1% of all digital search ad dollars were spent on mobile devices. This year, that share will reach 22.1%.
Read More