Display Advertising
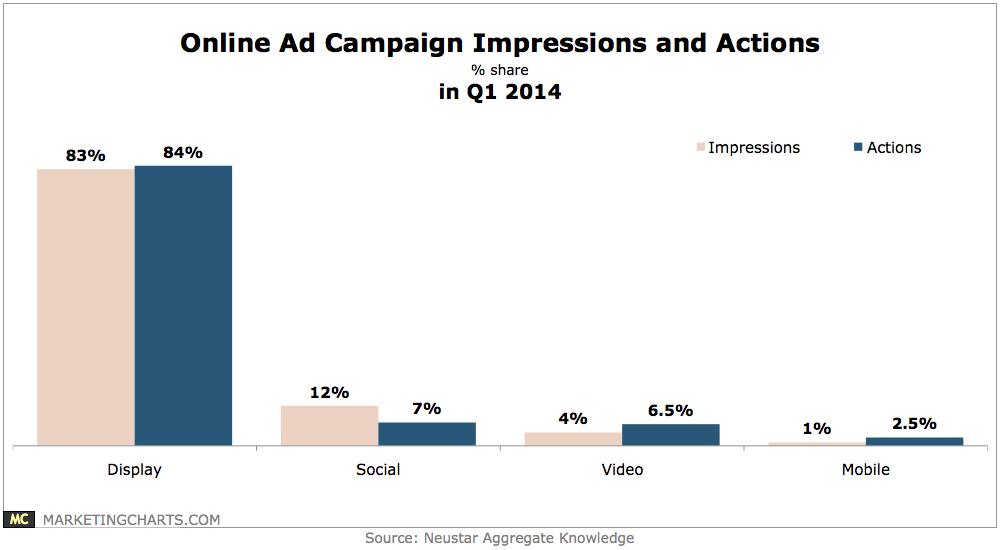
Online Ad Impressions & Actions, Q1 2014 [CHART]
The vast majority of digital marketing spend across display, social, video and mobile was allocated to display ads (83%), which delivered 84% share of actions.
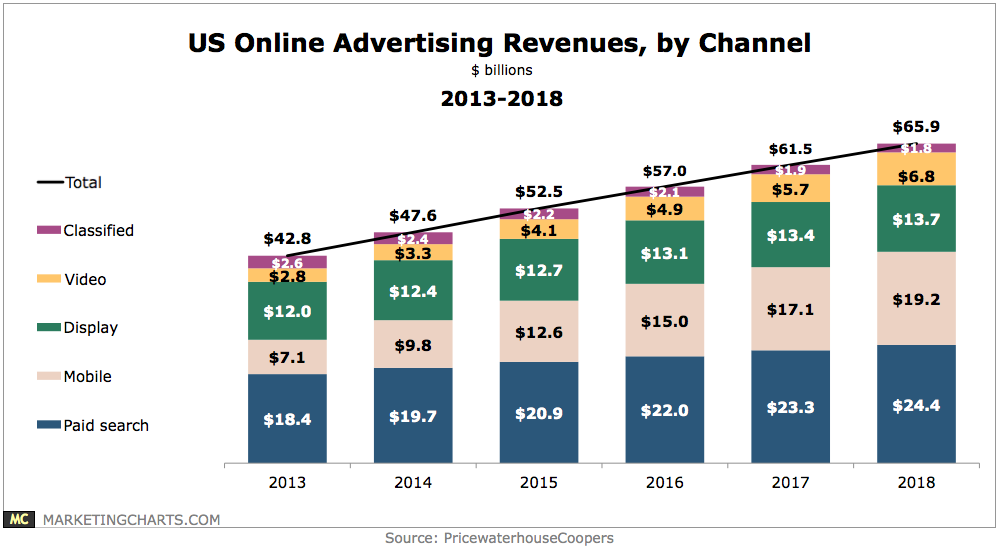
Read MoreUS Online Ad Revenues By Channel, 2013-2018 [CHART]
Mobile ad spending is growing at such a rate that it will soon overtake display advertising to become the second-largest digital advertising channel in the US.
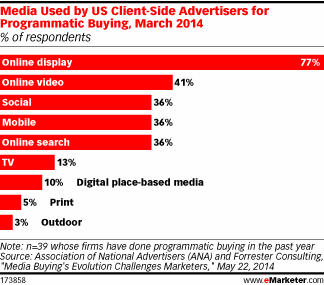
Read MoreTypes Of Programmatic Buying Used By Client-Side Advertisers, March 2014 [CHART]
More than half of marketers studied didn’t understand programmatic well enough to buy and execute campaigns with it.
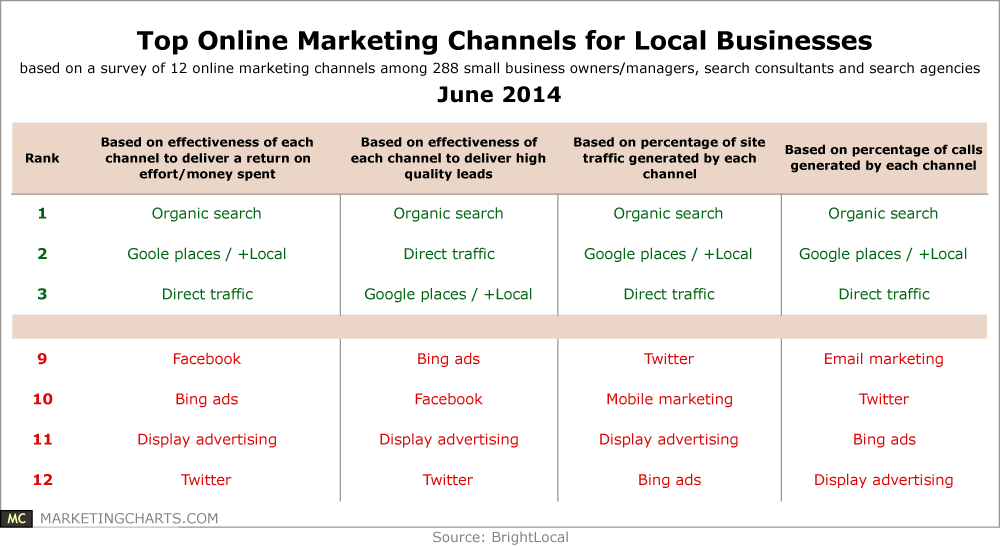
Read MoreTop Online Marketing Channels For Local Businesses, June 2014 [TABLE]
Of the 12 channels identified, organic search wins out as having the best ROI for local businesses.
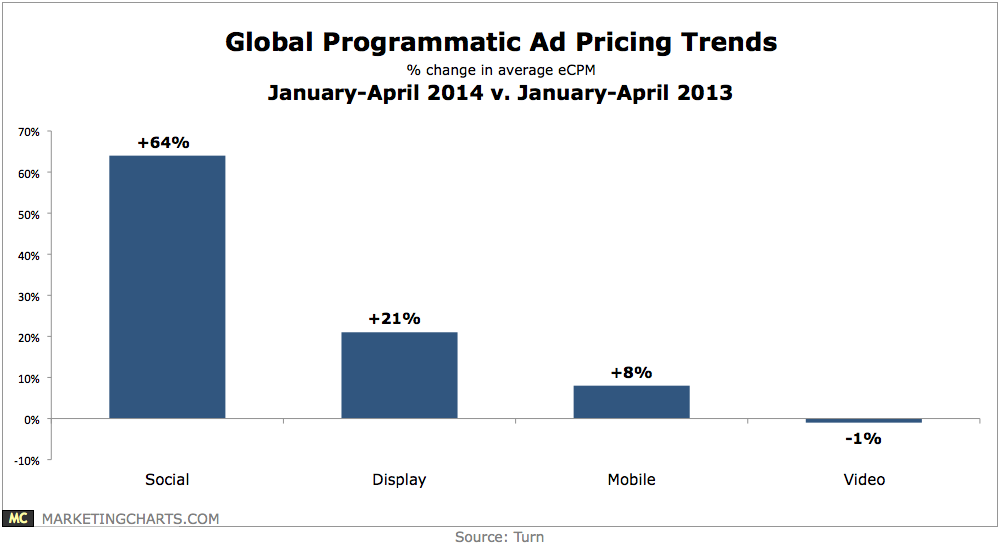
Read MoreGlobal Programmatic Ad Pricing Trends, 2013 vs 2014 [CHART]
Social and display advertising have become more competitive and seen a 64% and 21% year-over-year increase, respectively, in average eCPM from January through April 2014.
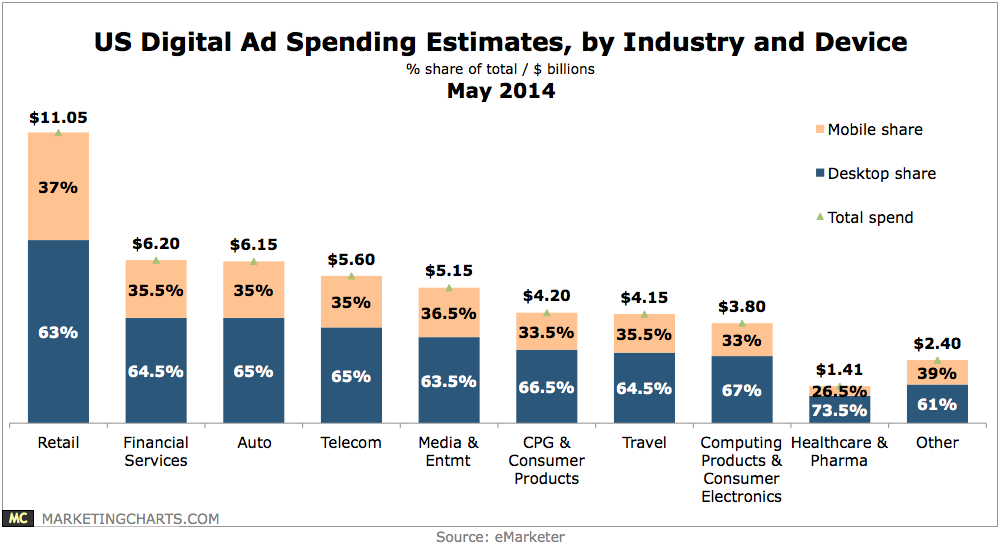
Read MoreUS Online Ad Spending Estimates By Industry, May 2014 [CHART]
Mobile accounts for slightly more than 35% of digital ad budgets this year.
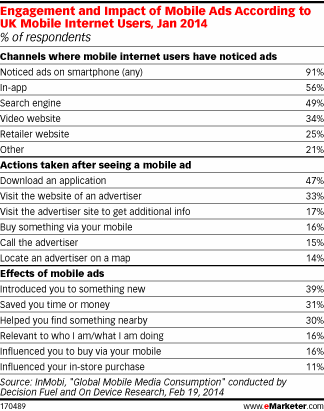
Read MoreEngagement & Impact Of Mobile Ads In UK, January 2014 [TABLE]
Because UK mobile internet users spend so much time with apps, it comes as no surprise to learn that in-app ads are the most commonly seen.
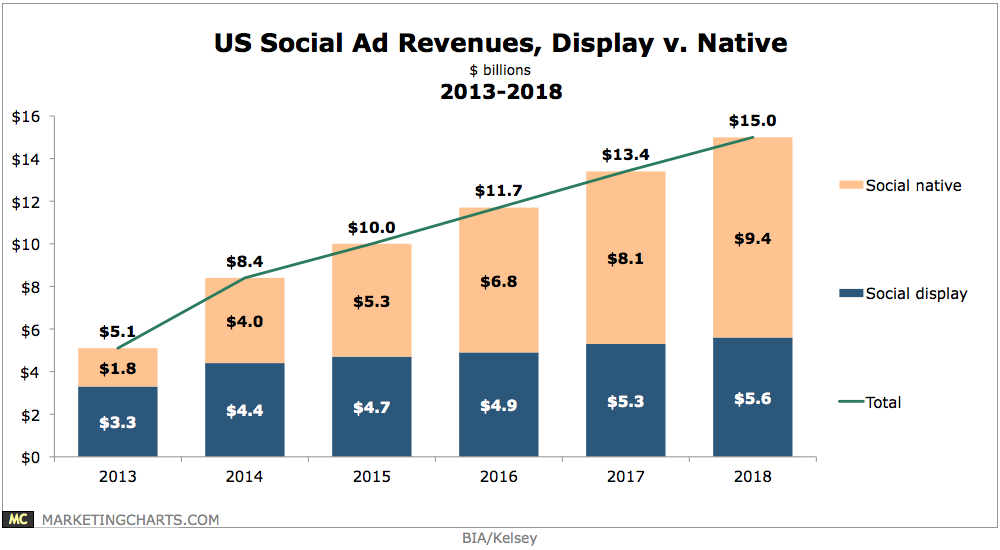
Read MoreUS Social Ad Revenues – Display vs Native, 2013-2018 [CHART]
Native social ads are expected to overtake social display ads in revenue next year.
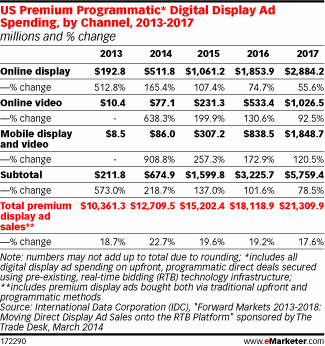
Read MoreUS Premium Programmatic Ad Spending By Channel, 2013-2017 [TABLE]
Spending on premium programmatic online display advertising will rise 165.4% in the US this year.
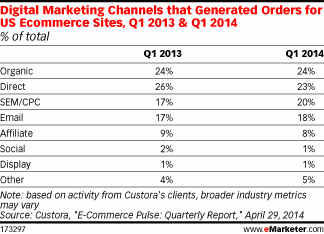
Read MoreTop Online Marketing Channels That Generated Orders, Q1 2013 & Q1 2014 [TABLE]
Social accounts for just 1% of US eCommerce orders in Q1 2014, tying display for the lowest share.
Read More