Digital Advertising
Top 5 Countries In Ad Spending, 2015 [TABLE]
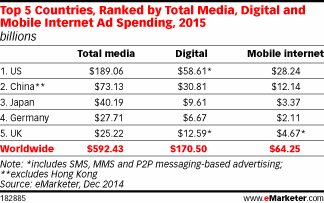
Around the world, advertisers will spend $592.43 billion in 2015, an increase of 6.0% over 2014.
Read MoreDisplay Ad Viewability Rates By Ad Size, July 2014 [CHART]
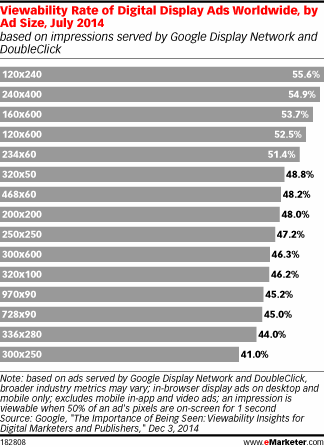
Vertical ad units were consistently the most viewable. Worldwide, 120×240 placements performed the best for viewability, with a rate of 55.6%.
Read MoreDesktop Display Ad Viewability & Engagement Metrics By Ad Size, Q3 2014 [TABLE]
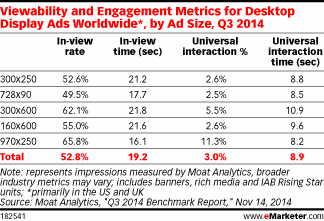
970×250 ads had the highest in-view rate out of desktop display ads studied worldwide during Q3 2014, at 65.8%.
Read MoreChange In Ad Spend By Medium, Q1-Q3 2014 [CHART]
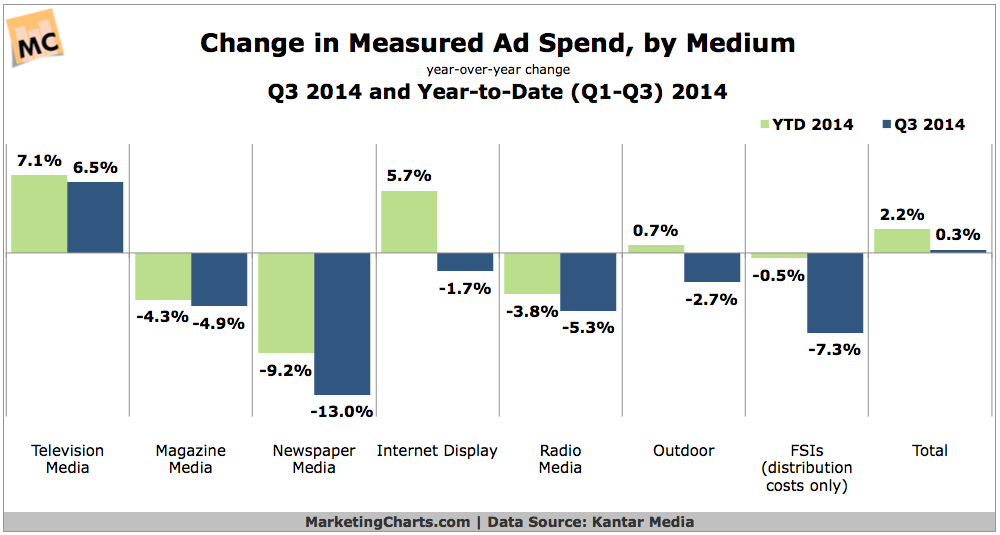
US ad spending grew by just 0.3% year-over-year in the third quarter to reach $33.7 billion, with year-to-date growth slowing to 2.2%.
Read MoreMost Influential Advertising Among Hispanic Shoppers, December 2014 [CHART]

TV, online display, and social are the advertising media most likely to influence Hispanics who shop online, almost 8 in 10 of whom are aged 18-34.
Read MoreAd Traffic Generated By Bots By Industry, September 2014 [TABLE]
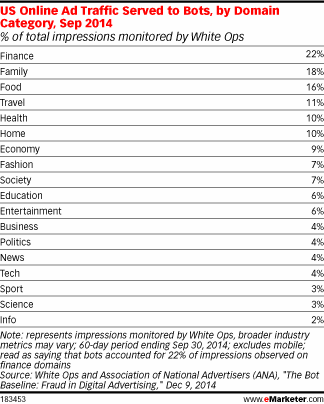
Finance, family and food domains were the most susceptible to bots, with respective traffic rates coming in at 22%, 18% and 16%.
Read MoreTop Drivers of Online Brand Ad Spending, December 2014 [CHART]
Marketers are shifting their digital campaigns from direct response to brand advertising.
Read MoreUS Online Ad Revenue, 2005-2014 [CHART]
Online ad revenues in the US have set yet another peak after growing 17% year-over-year in Q3 to reach $12.4 billion.
Read MoreTop 15 Advertising Channels For Wealthy Boomers, December 2014 [CHART]
TV ads have the broadest reach among upscale Boomers (those aged 50-68 with household income of at least $75k).
Read More2015 Marketing Spending Plans By Channel, December 2014 [CHART]
54% of business leaders expect their marketing budgets to grow next year (up from 46% last year.
Read More