Digital Advertising
US Real-Time Bidding Display Ad Spending, 2011-2017 [CHART]

eMarketer estimates that total US RTB digital display ad spending will rise by 73% this year, after more than doubling in 2011 and nearly doubling again in 2012.
Read MoreAd Awareness By Generation & Context, April 2013 [CHART]
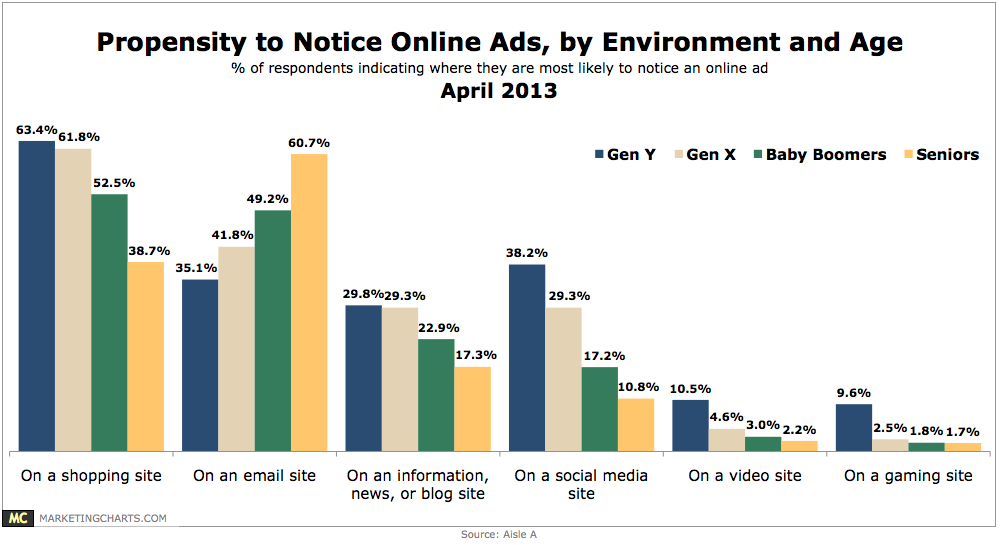
About half of consumers often (18.2%) or sometimes (33%) pay attention to online ads.
Read MoreMost Influential Ad Platforms For Automotive Purchase Decisions, March 2012 [CHART]
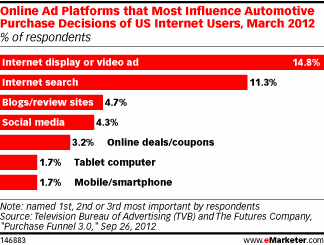
55% of respondents’ digital ad spending went to paid search engine marketing (SEM).
Read MoreNewspaper Revenue Trends, 2011 vs 2012 [TABLE]
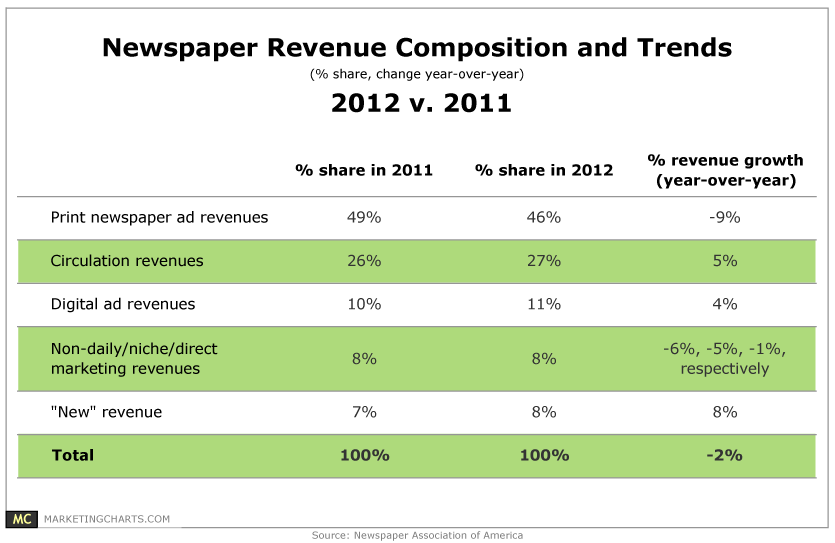
Newspaper ad revenues dropped by 6% last year, marking the 7th consecutive year of declines after a 7.3% fall last year.
Read MoreEffective Channels For Engaging & Attracting Small Business Customers, October 2012 [CHART]
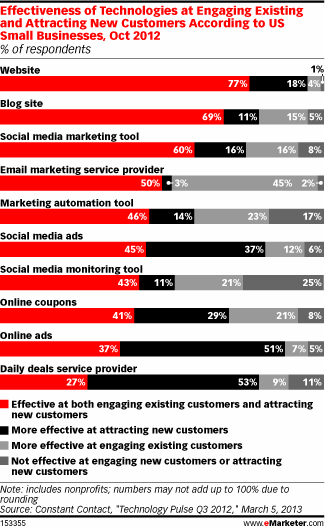
77% said the site was well-suited both to engaging existing customers and attracting new ones.
Read MoreAnnoying Ads, April 2013 [CHART]
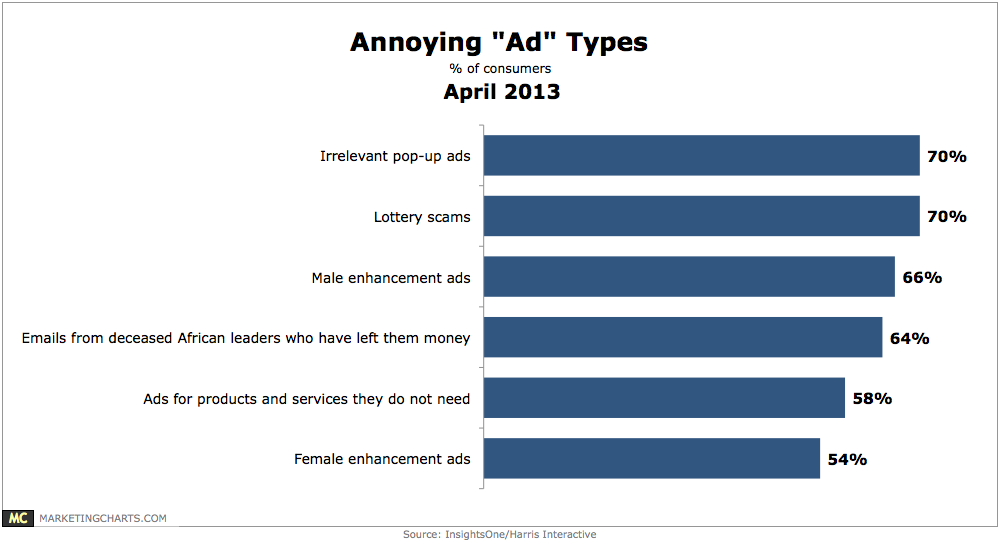
More Americans are annoyed by irrelevant pop-up ads (70%) than by male (66%) or female (54%) enhancement ads.
Read MoreChannel ROI Ratings, April 2013 [CHART]
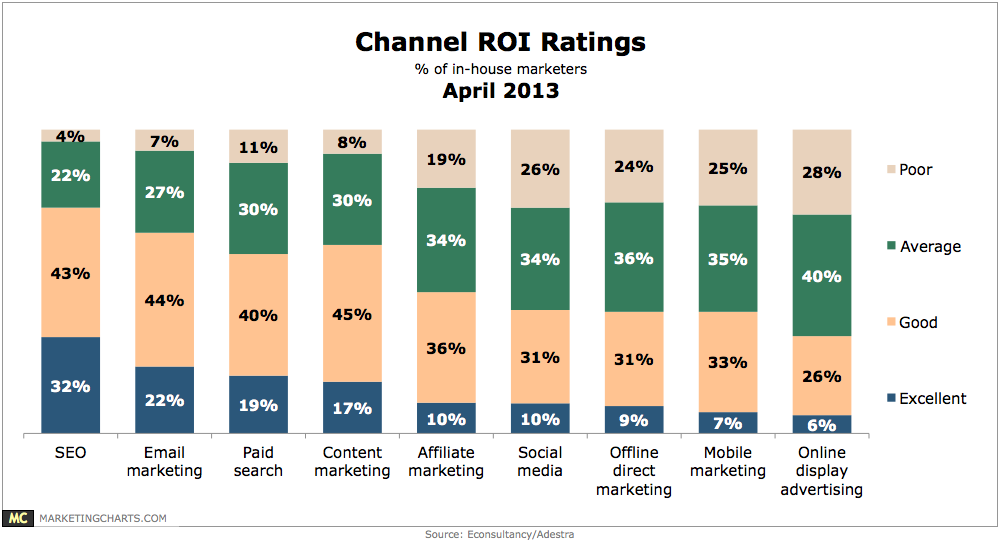
75% of global marketers (primarily from the UK) rate SEO as “excellent” (32%) or “good” (43%) in terms of return on investment.
Read MoreUS Real-Time Bidding Display Ad Spending, 2011-2017 [CHART]
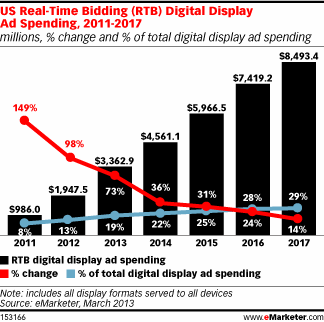
US advertisers will spend more than $3.36 billion on real-time bidding this year, up from just under $2 billion in 2012 and less than $1 billion in 2011.
Read MoreUS Television vs. Online Ad Spending, 2011-2017 [CHART]
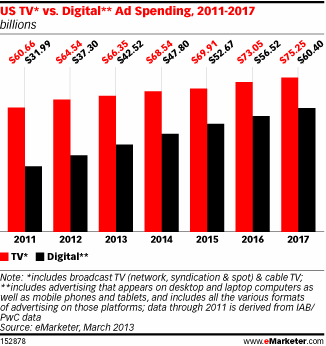
Advertisers will spend $66.35 billion on TV this year, up from $64.54 billion in 2012 and set to rise to over $75 billion by 2017.
Read MoreRadio Advertising Revenue, 2006-2017 [CHART]
Radio revenues will continue to shift in the next 5 years, as income from online advertising grows by about 10.8% annually versus 2.5% growth for over-the-air (OTA) revenues.
Read More