Digital Advertising
Q1 Online Ad Revenues, 1996-2013 [CHART]
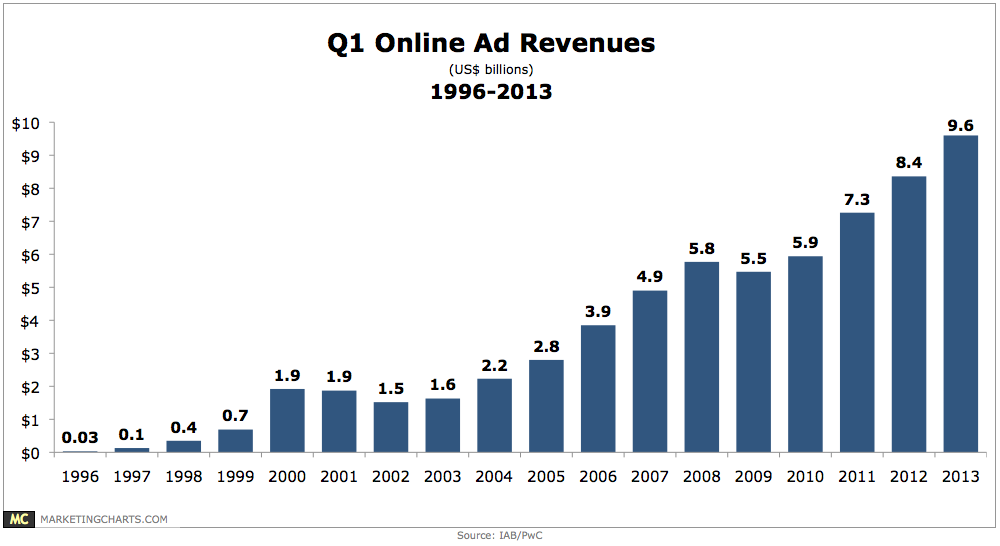
Online ad revenues grew by 15.8% year-over-year in Q1, increasing from $8.3 billion to $9.6 billion.
Read MoreAutomating Marketing Decision-Making Process By Channel, 2013 [CHART]
The key to real-time marketing is to use data and analysis to deliver automated real-time messaging, which can rapidly respond to customer actions.
Read MoreContext-Sensitive Real-Time Offers, 2013 [CHART]
About two in five leaders were already putting out real-time offers this year to customers based on customer context, a relatively sophisticated process.
Read MoreUS Travel Industry Online Ad Spending, 2011-2017 [CHART]
Travel advertisers will devote nearly three-quarters of spend to direct response formats.
Read MoreUS CPG Online Ad Spending, 2011-2017 [CHART]
CPG advertisers are focused on branding efforts: 62% of digital spending will go toward banner ads, rich media, sponsorships and video, eMarketer estimates.
Read MoreUS Financial Services Online Ad Spending, 2011-2017 [TABLE]
Digital ads placed by financial services firms in the US will account for 12.4% of total digital ad spending this year, a share that will also hold steady throughout the forecast period.
Read MoreUS Retail Online Ad Spending, 2011-2017 [TABLE]
Though growth rates for retail digital ad spending are falling, with a 14% increase expected this year, the industry will hold on to a steady share of total spending throughout the forecast period.
Read MoreUS Online Ad Spending Growth By Industry, 2011-2017 [TABLE]
Four of the six industries growing their digital ad spending at or above overall market rates are retail, financial services, consumer packaged goods & travel.
Read MoreAmazon's Net US Ad Revenues, 2011-2015 [CHART]
In 2013, Amazon will net $660 million in US ad revenues, rising to $1.1 billion by 2015.
Read MoreAmazon Worldwide Ad Revenue, 2011-2013 [CHART]
Amazon took in nearly $610 million last year worldwide in net ad revenues.
Read More