Digital Advertising
Ad Viewability Benchmarks By Site Type, 2012 [CHART]
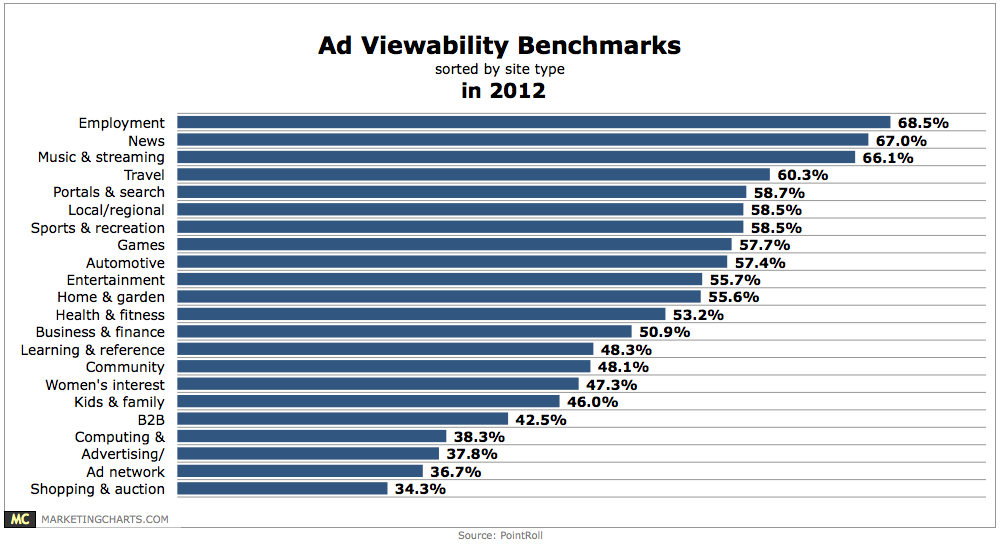
Covering 2012 activity, the data shows that viewability rates were lowest on shopping and auction (34.3%) and ad network (36.7%) sites, and highest on employment (68.5%), news (67%) and music and streaming media (66.1%) sites.
Read MoreConsumer Attitudes Toward Online Personal Data Collection, June 2013 [CHART]
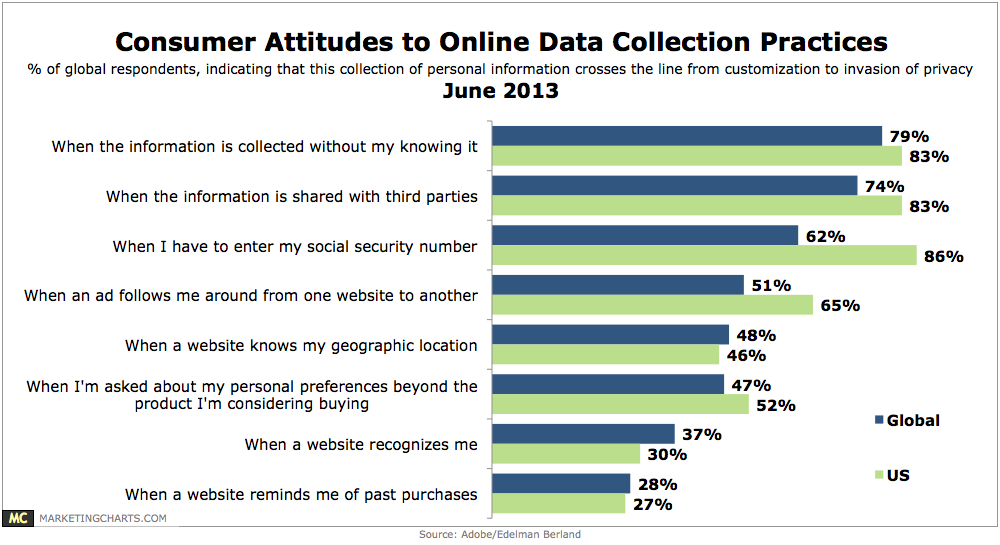
Consumers around the world find website customization to be of some value, with 33% of respondents attributing some value to personalized product and service recommendations on websites, compared to 26% seeing little to no value.
Read MoreBest Sources For Marketing & Advertising, June 2013 [CHART]
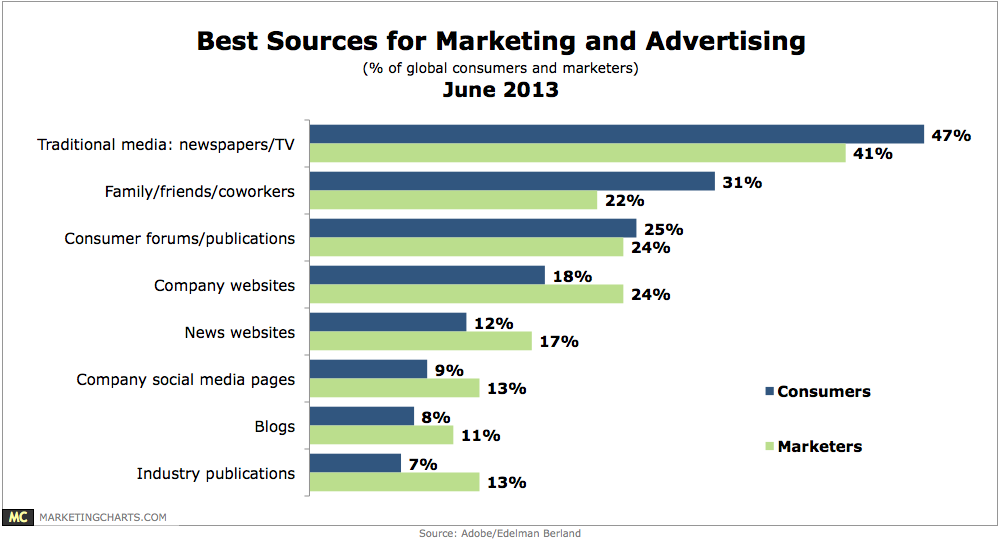
Consumers were more likely than marketers to choose traditional media sources such as newspapers and TV as best for advertising (47% vs. 41%), and also more likely to see their family, friends and co-workers as influential (31% vs. 22%).
Read MoreUS Mobile Display Ad Revenues By Company, 2011-2015 [TABLE]
Facebook is the leading player and will rake in just over one in three mobile display dollars this year, after traffic acquisition costs (TAC).
Read MoreGlobal Net Online Ad Revenues By Company, 2011-2013 [TABLE]
Both Google and Facebook are increasing revenues at faster rates than the overall digital ad spend market.
Read MoreGlobal Online Ad Revenue Share By Company, 2011-2013 [TABLE]
Google continues to reign as not only the largest beneficiary of digital ad spending in the US, but worldwide as well.
Read MoreAd Spending Share Of US Automobile Dealerships By Media, 2002-2012 [TABLE]
Dealers have dramatically increased their digital ad spending over the past decade, from just 5.0% of spending in 2002 to 26.5% in 2012.
Read MoreUS Automotive Online Ad Spending, 2011-2017 [TABLE]
The US automotive industry will spend $5.07 billion in 2013 on paid digital advertising, and that total is expected to rise to $7.80 billion by 2017.
Read MoreUS Google Net Ad Revenues, 2011-2015 [TABLE]
Mobile’s rapid expansion will help that channel rival the desktop in both search and display revenues for Google by 2015.
Read MoreUS Digital Ad Spending By Channel, 2011-2017 [CHART]
Desktop ad spending will peak in 2014 at $35.39 billion, up from this year’s projected total of $34.29 billion.
Read More