Digital Advertising
Global eCPM Averages, March vs June 2013 [CHART]
Global eCPM averages increased on a quarter-over-quarter basis across display, mobile, social and video channels.
Read MoreUS Online Display Ads That Are In-View, February 2013 [CHART]
Less than half of US display ad impressions delivered between May 2012 and February 2013 were in-view, defined as at least 50% of the ad visible for one second or more.
Read MoreWhy Americans Engage With Online Ads, July 2013 [CHART]
44% of Americans claim to have watched a commercial for a brand or product online in the past month.
Read MoreOnline Pharmaceutical Marketing Effectiveness, June 2013 [CHART]
Prospects who visited a branded pharmaceutical site demonstrated a 14.8-point lift in aided awareness and an 8.8-point lift in unaided awareness.
Read MoreGlobal Ad Spending Forecast By Medium, 2012 vs 2013 [TABLE]
Warc believes that global expenditures will now increase by 3.4% as opposed to an initial assessment of 4% growth made in January.
Read MoreeCommerce Customer Acquisition Channel Comparison, 2009-2013 [TABLE]
Organic search has not only accounted for the greatest percentage of acquired customers over the past 4 years, but it also boasts the highest CLV relative to the average.
Read MoreAdvertising Management Methods By Frequency, December 2012 [TABLE]
Very few marketers in December 2012 were trying to make changes in their advertising activities on a daily basis.
Read MoreConsumer Attitudes Toward Online Tracking, June 2013 [CHART]
Internet users overwhelmingly disagree with the premise that they find online tracking to be harmless if it results in their being shown more relevant ads.
Read MoreGlobal Online Ad Spending Forecast By Format, 2013 [CHART]
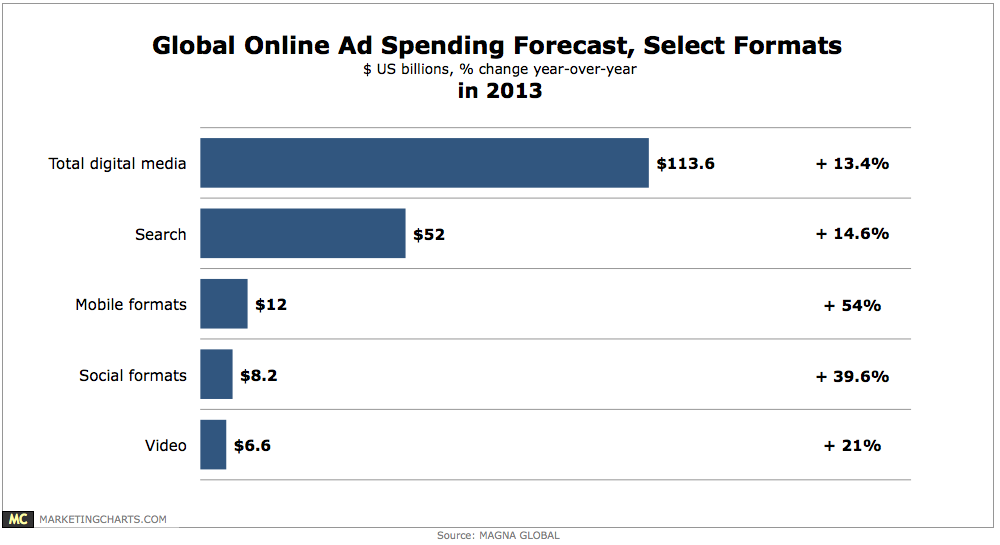
Online ad spending around the world is projected to grow by 13.4% to reach $113.6 billion this year.
Read MoreUS Online Sponsorship Ad Spending, 2011-2017 [CHART]
eMarketer estimates sponsorship spending in the US will rise 22.1% this year, from $1.54 billion in 2012 to $1.88 billion.
Read More