Digital Advertising
US Digital Ad Spending By Format, 2011-2017 [TABLE]
This year, 21.7% of all digital display ad spending will be on mobile, rising to 48.4% by 2017.
Read MoreUS Mobile Ad Spending By Format, 2011-2017 [TABLE]
In 2010, just 2.1% of all digital search ad dollars were spent on mobile devices. This year, that share will reach 22.1%.
Read MoreUS B2B Marketers' Budgets, 2011 & 2012 [TABLE]
Marketing automation had the largest year-over-year growth of any area in B2B marketers’ budgets with 233%.
Read MoreAdvertising Tactics Brand Marketers Plan To Use More, February 2013 [CHART]
US brand marketers, in particular, will double down on social media, mobile and video this year, with 70%, 69% and 64%, respectively, increasing their use of these tactics.
Read MoreChanges In B2B Marketing Spending During Next Year, March 2013 [TABLE]
45% B2B marketers expected to increase search engine advertising spending.
Read MoreUS Online Buyers Who Notice Retargeted Ads, April 2013 [CHART]
Nearly three out of five US online buyers said they had noticed ads for products they looked up on other sites.
Read MoreB2B Marketers' Most Successful Platforms, August 2013 [CHART]
Face-to-face event attendance is rated the most successful platform, by a fairly wide margin.
Read MoreAttitudes Toward Ads On Streaming TV & Movies, August 2013 [TABLE]
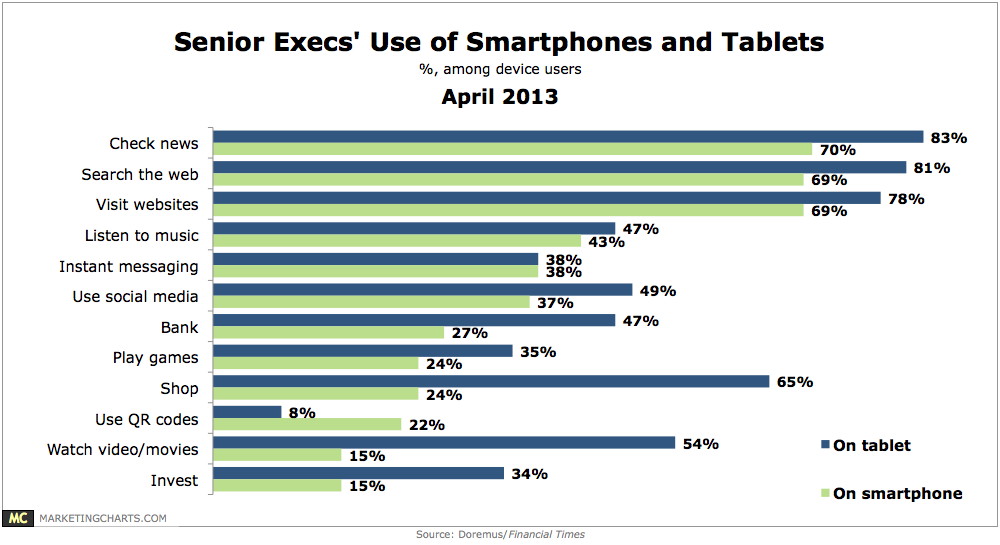
With increasing numbers of Americans watching video on their smartphones and tablets, it’s important to gauge their reactions to the ads they see while streaming entertainment content.
Read MoreUS Travel Online Ad Spending, 2011-2017 [CHART]

The US travel industry’s advertising spending in paid digital media will hit $3.35 billion in 2013 and will rise to $4.96 billion by 2017.
Read MoreMarketing Tactics Influenced By Data & Audience Information, June 2013 [CHART]
One-third of respondents said data influenced 75% to 100% of their digital marketing budget, while another third said it affected 50% to 75% of outlays.
Read More