Digital Advertising
US Online Display Ad Spending Share By Format, 2011-2017 [CHART]
eMarketer estimates that video’s share of the overall digital display budget will rise from 23.4% this year to 30.7% by 2017.
Read MoreConsumers' Definitions Of Online Recommendations, August 2013 [CHART]
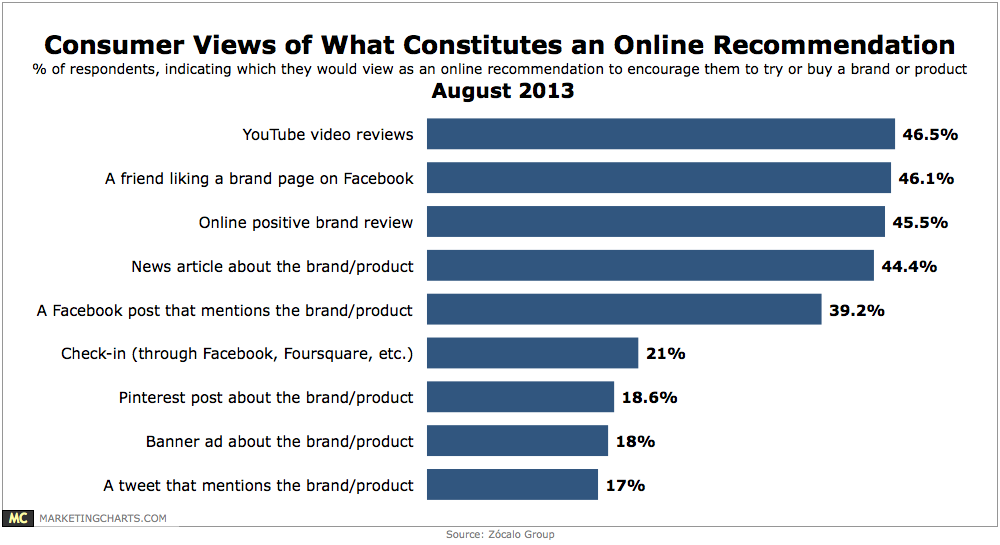
Whatever the reason for a friend’s like, many consumers consider it to be a recommendation.
Read MoreGlobal Online Ad Spending By Region, 2011-2017 [TABLE]
North America will remain the No. 1 digital ad market throughout the forecast period, with Asia-Pacific in second place.
Read MoreNet Online Ad Revenues By Company, 2011-2013 [TABLE]
Facebook’s worldwide ad revenues are expected to reach $6.36 billion this year.
Read MoreNet Online Ad Revenue Share By Company, 2011-2013 [TABLE]

Across all devices, Google remains by far the No. 1 digital ad publisher in the world and will take in nearly 33% of all digital ad dollars worldwide this year.
Read MoreAd Agencies' Changing Media Mix, August 2013 [TABLE]
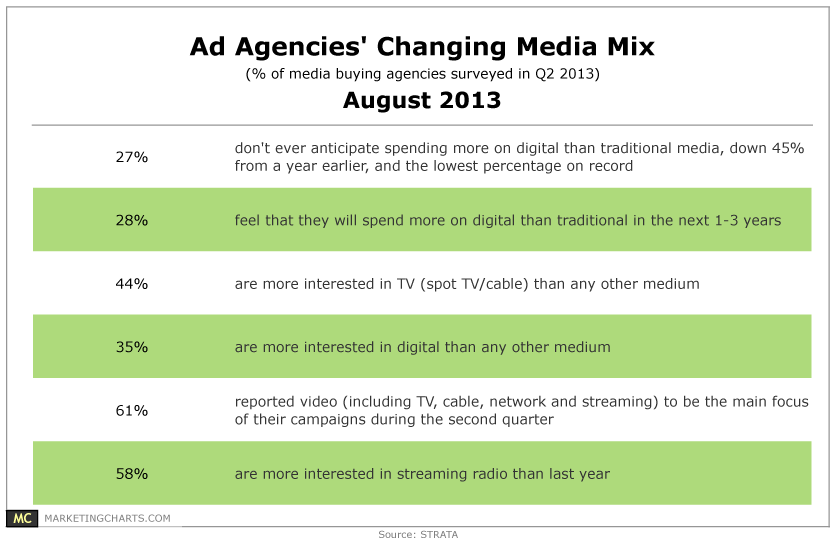
Just 27% of media buying agencies don’t anticipate ever spending more on digital than traditional media.
Read MoreUS Mobile & Online Ad Spending, 2012-2017 [CHART]
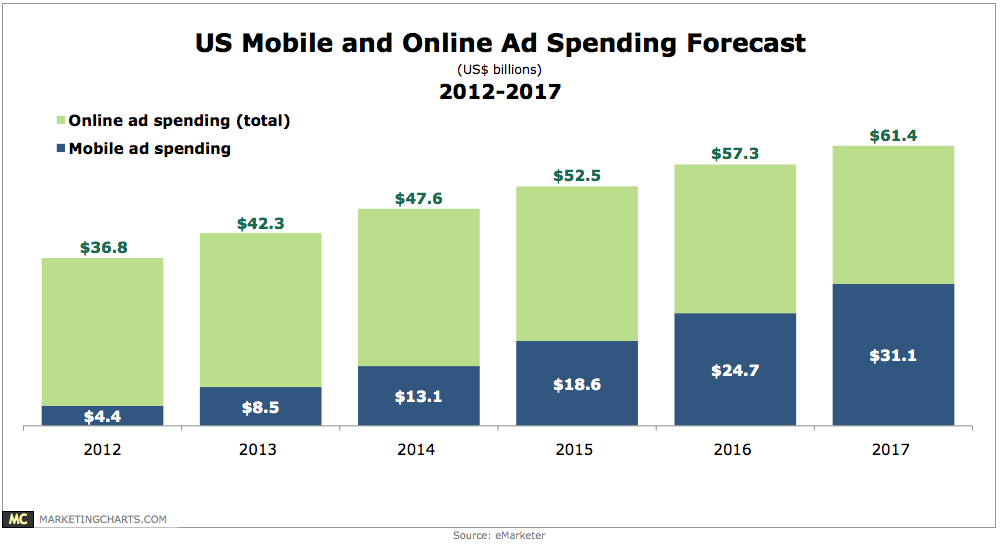
Mobile will capture a slight majority of US online ad spending in 2017.
Read MoreLanding Page Optimization Metrics, August 2013 [TABLE]
The greatest percentage considered conversion to be the most useful metric for analyzing the performance of their landing pages.
Read MoreUS Real-Time Bidding Digital Ad Spending, 2012-2017 [CHART]
Marketers will spend $3.34 billion this year on real-time-bidded ads, up 73.9% from last year.
Read MoreUS Digital Ad Spending, 2011-2017 [CHART]
US digital ad spending will hit $42.26 billion this year, up from $36.80 billion in 2012, to account for 24.7% of total media ad spending this year.
Read More