Digital Advertising
Media Spend Channel Efficiency Comparison, Q3 2013 [CHART]
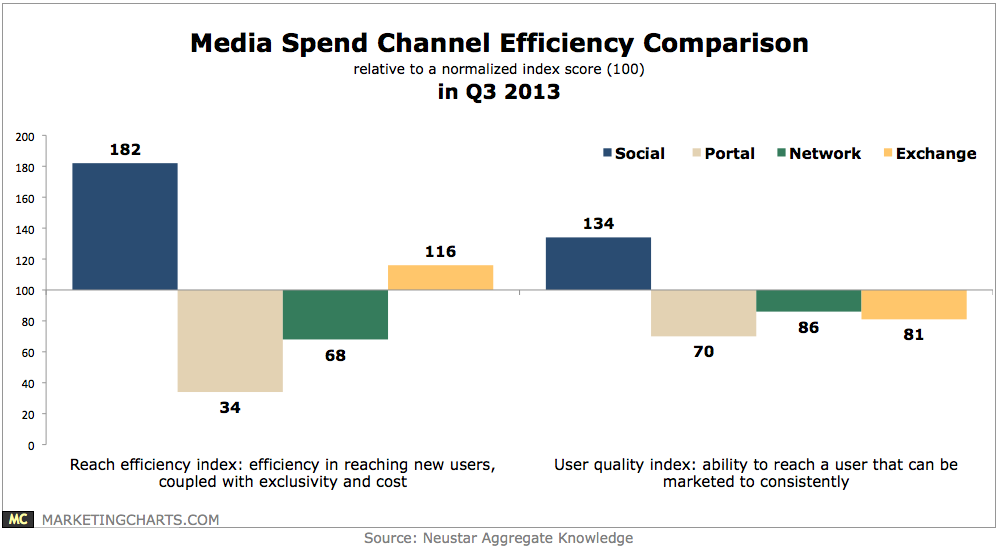
During Q3, social again beat portals, networks, and exchanges in user quality index – a measure that refers to a channel’s ability to reach a user that can be marketed to consistently.
Read MoreUS Display Ad Spending Share By Type, 2011-2017 [CHART]
RTB is primarily used to purchase impression-level inventory in order to meet a performance-based goal.
Read MoreUS Programmatic Display Ad Spending, 2011-2017 [CHART]
MAGNA GLOBAL estimates US programmatic display ad spending will reach $7.5 billion this year.
Read MoreUS Retail Online Ad Spending, 2012-2017 [CHART]
By the end of this year, eMarketer predicts, US retailers will have increased digital ad budgets by 15.7% to $9.50 billion, following growth of 14.5% last year.
Read MoreFrequency With Which Marketers Check Their Data Sources, November 2013 [CHART]
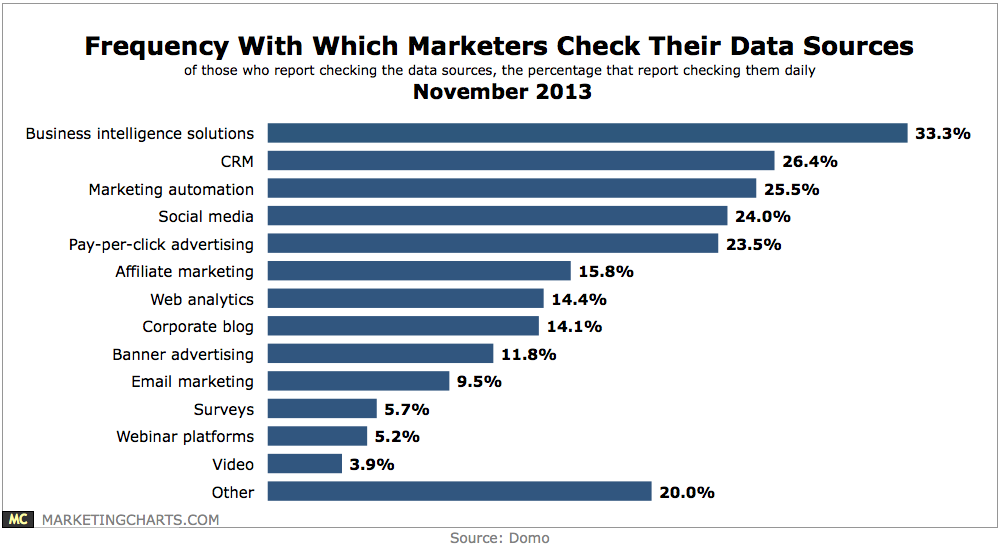
For all the talk about real-time insights, it turns out that very few marketers are actually looking at their data sources every day.
Read MoreUS Real-Time Bidding Display Spending Comparative Estimates, 2012-2017 [TABLE]
MAGNA GLOBAL forecasts $3.9 billion in US RTB digital display ad spending for 2013—the highest of all firms.
Read MoreUS Real-Time Bidding Display Ad Spending, 2012-2017 [CHART]
eMarketer projects RTB digital display ad spending in the US will account for 29.0% of total US digital display ad spending by 2017, or $9.03 billion.
Read MoreLocal Advertising Revenue Shares By Channel, 2013 [CHART]
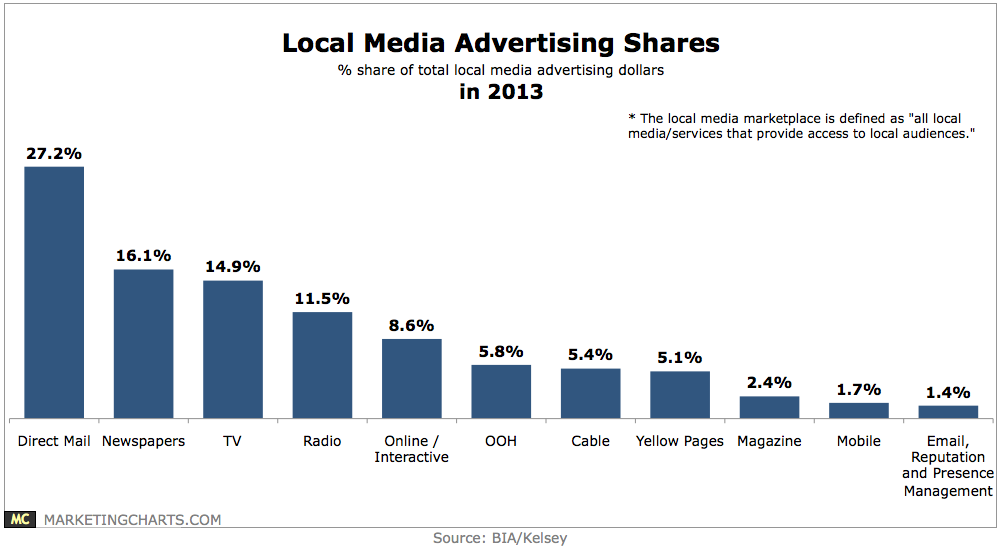
BIA/Kelsey estimates total advertising spending on local media this year to be $132.7 billion.
Read MoreUS Telecom Industry Online Ad Spending By Objective, 2013 [CHART]
eMarketer estimates the US telecom industry will spend 55%, or $2.65 billion, on direct-response advertising in 2013.
Read MoreComparative Estimates Of US Digital Sponsorship Ad Spending, 2012-2017 [TABLE]
Newspapers and magazines will see digital ad revenue growth increase 5.6% and 13.3%, respectively, this year.
Read More