Digital Advertising
US Health Care & Pharma Online Ad Spending, 2012-2018 [CHART]
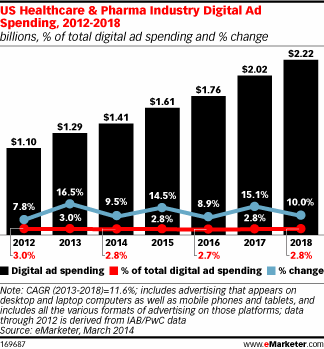
The US health care and pharmaceutical industry will spend $1.41 billion on paid digital media in 2014.
Read MoreUS Automotive Online Ad Spending By Device, 2014 [CHART]
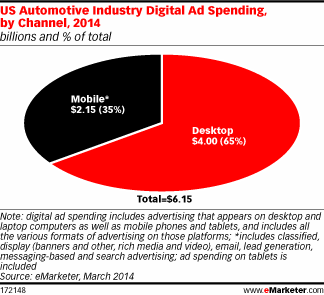
More than one-third (35%) of US automotive-related digital ad spending will be on mobile this year.
Read MoreUS Automotive Online Ad Spending, 2012-2018 [CHART]
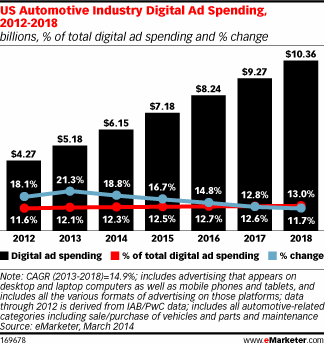
Automakers and dealers will spend $6.15 billion on US digital advertising in 2014, up 18.8% from the previous year.
Read MoreUS Retail Online Ad Spending By Device, 2014 [CHART]
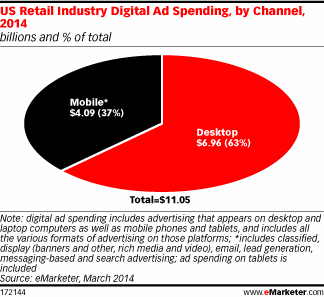
Consumers’ widespread use of mobile devices is helping drive retail’s turn to digital media.
Read MoreUS Retail Online Ad Spending, 2012-2018 [CHART]
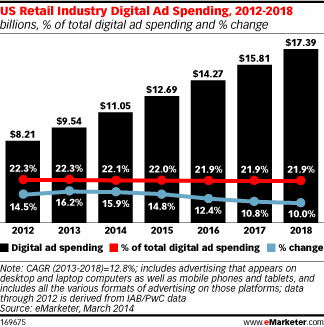
The US retail industry’s advertising spending on paid digital media will reach $11.05 billion in 2014 and rise to $17.39 billion by 2018.
Read MoreUS Financial Services Online Ad Spending By Objective, 2014 [CHART]
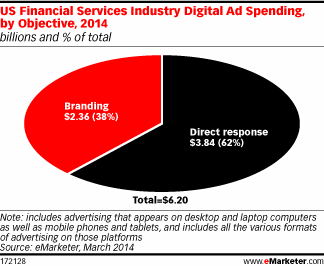
In 2014, financial marketers will dedicate $3.84 billion, or 62% of their total digital ad spending, to direct response.
Read MoreUS Financial Services Online Ad Spending, 2012-2018 [CHART]
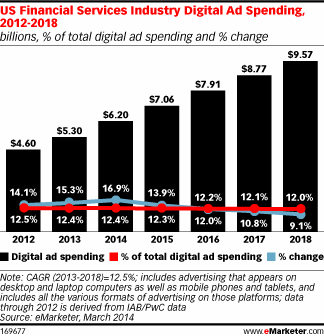
Advertising spending in paid digital media by the US financial services industry will hit $6.20 billion in 2014 and rise to $9.57 billion by 2018, for a five-year compound annual growth rate of 12.5%.
Read MoreUS Media & Entertainment Online Ad Spending By Objective, 2014 [CHART]
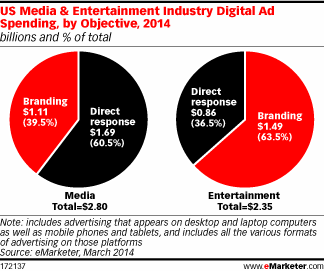
US media leans toward the direct-response side, with roughly a 60-40 split between direct response and branding.
Read MoreUS Media & Entertainment Online Ad Spending, 2012-2018 [CHART]
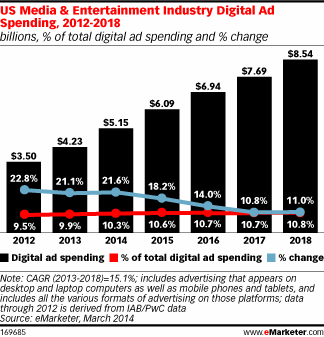
Digital advertising spending is expected to grow faster in media and entertainment than in other US industries.
Read MoreUS Online Ad Spending Estimates By Industry, May 2014 [CHART]
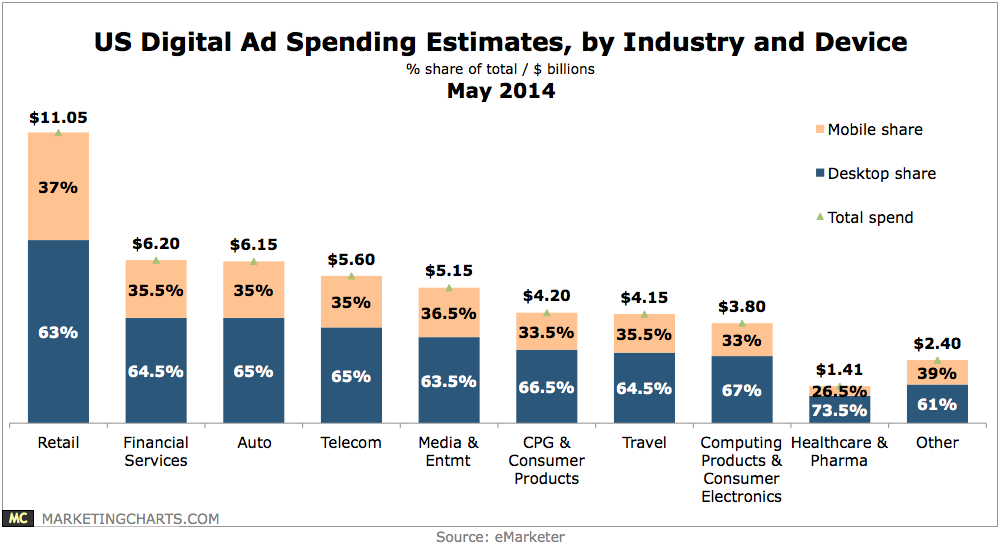
Mobile accounts for slightly more than 35% of digital ad budgets this year.
Read More