Digital Advertising
Global Net Mobile Ad Revenues By Company, 2012-2014 [TABLE]

In Q1 2014, Facebook saw a 72% year-over-year rise in total global revenues, driven by mobile, which accounted for 59% of ad revenues during the same period—up from 30% a year prior, the company said.
Read MoreOnline Advertising's Ability To Deliver On Branding Promise, June 2014 [CHART]
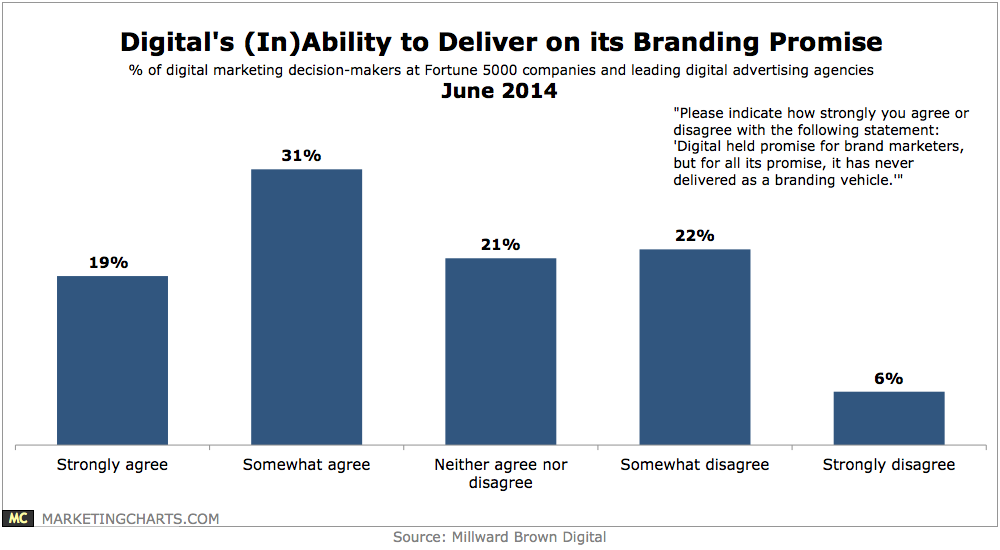
By 2017, digital advertising dollars are expected be almost equally split between branding and direct response objectives.
Read MoreOnline Ad Impressions & Actions, Q1 2014 [CHART]
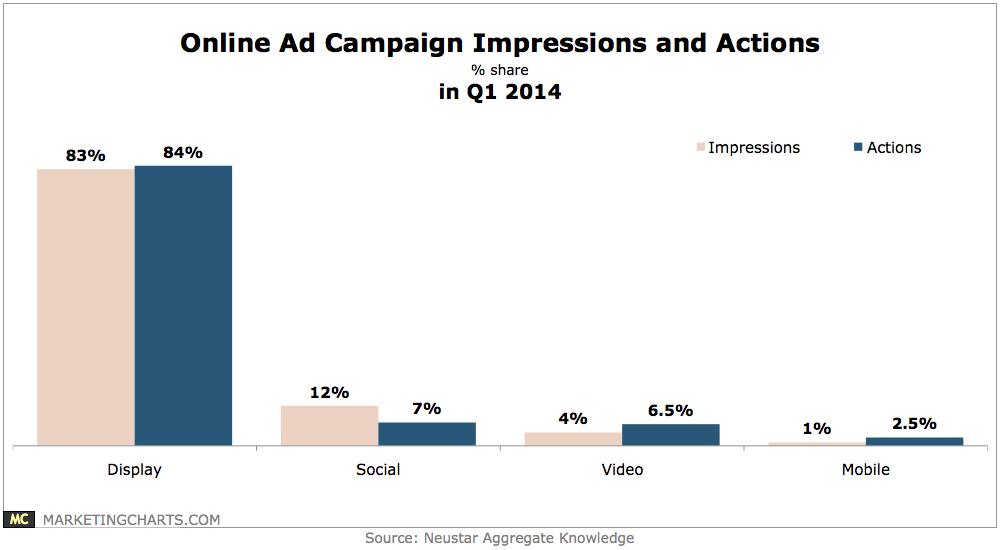
The vast majority of digital marketing spend across display, social, video and mobile was allocated to display ads (83%), which delivered 84% share of actions.
Read MoreUS Online Ad Revenues By Channel, 2013-2018 [CHART]
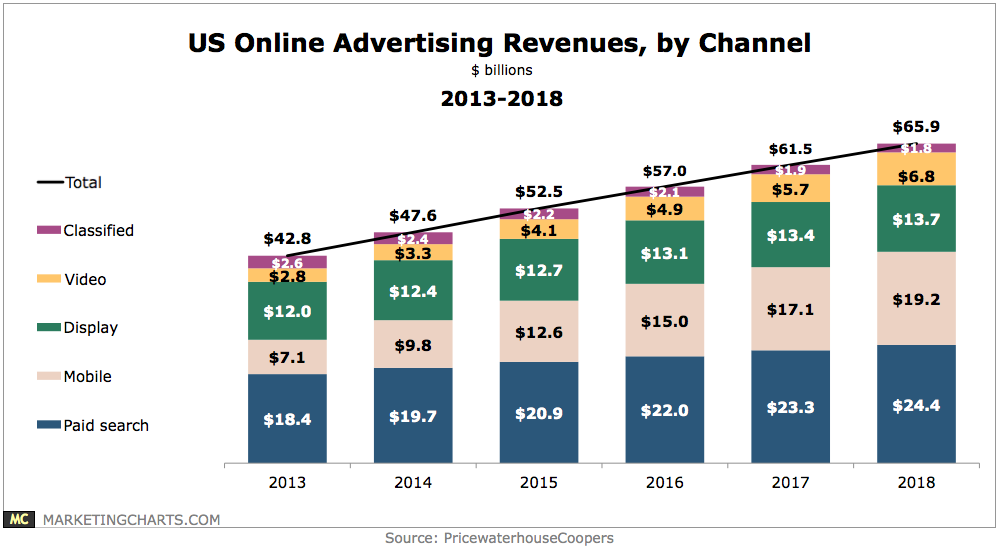
Mobile ad spending is growing at such a rate that it will soon overtake display advertising to become the second-largest digital advertising channel in the US.
Read MoreUS Advertising Market Sizes By Medium, 2013 v. 2018 [CHART]
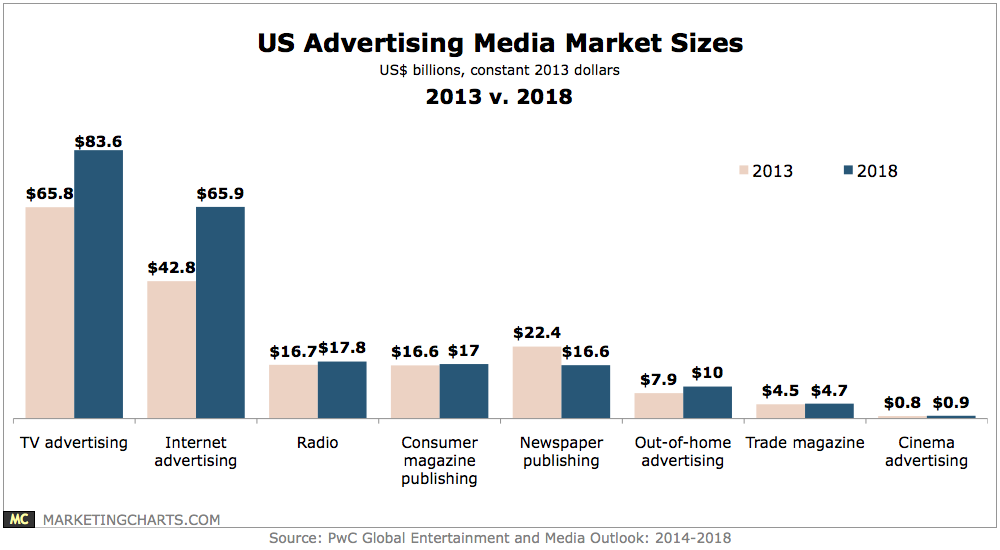
TV will remain the dominant advertising market in the US through 2018, when it is projected to reach $83.6 billion in revenues.
Read MoreUS Client-Side Advertisers Who Have Expanded Programmatic Buying, March 2014 [CHART]
US client-side marketers who were using programmatic appeared uncomfortable handling the tactic in-house.
Read MoreTypes Of Programmatic Buying Used By Client-Side Advertisers, March 2014 [CHART]
More than half of marketers studied didn’t understand programmatic well enough to buy and execute campaigns with it.
Read MoreConsumer Attitudes Toward Personalized Ads, June 2014 [CHART]
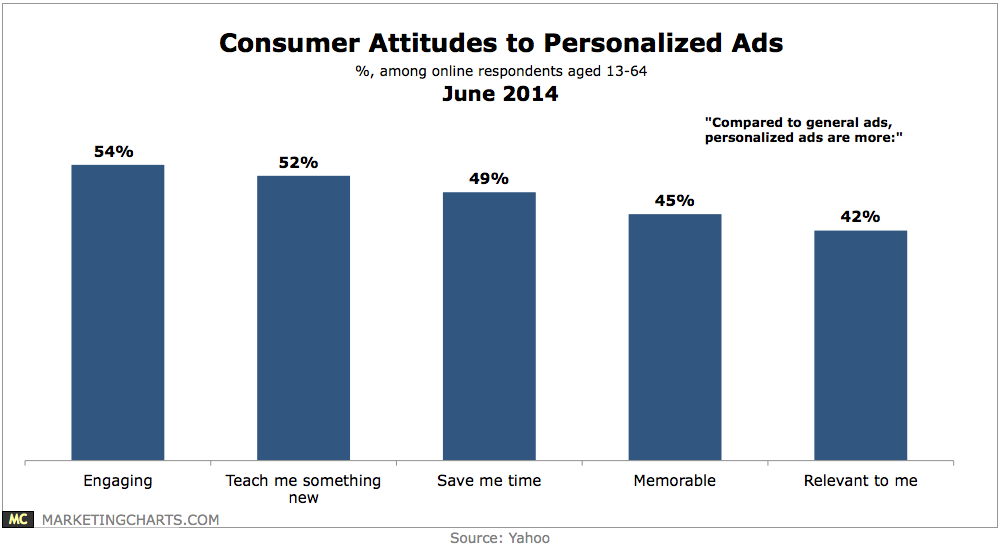
Compared to general ads, many consumers find personalized ads to be more engaging, educational, time-saving and memorable.
Read MoreGlobal Programmatic Ad Pricing Trends, 2013 vs 2014 [CHART]
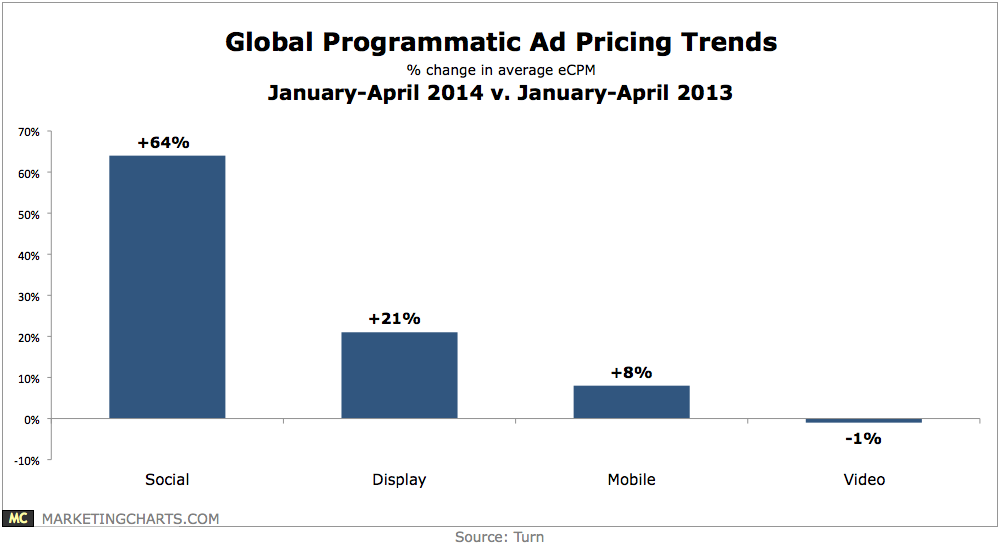
Social and display advertising have become more competitive and seen a 64% and 21% year-over-year increase, respectively, in average eCPM from January through April 2014.
Read MoreWestern European Online Ad Spending By Country, 2012-2018 [TABLE]
Spending on display ads continued to gain momentum, logging higher growth than any other format, at 14.9%, and a total value of $12.27 billion.
Read More