Digital Advertising
Net US Online Ad Revenue Share By Company, 2012-2016 [TABLE]
Google alone already accounts for more than 10% of all advertising spending in the US.
Read MoreUS Online Ad Spending By Channel, 2012-2018 [TABLE]
Strong, steady growth in mobile advertising will push digital ads to represent nearly 30% of all US ad spending this year.
Read MoreTotal US Ad Spending Share By Media, 2012-2018 [TABLE]
US adults will spend an average of 2 hours 51 minutes per day with mobile devices this year.
Read MoreChange In Ad Spending By Medium, Q1 2014 [CHART]
Total ad expenditures in Q1 grew by 5.7% year-over-year to $34.9 billion, boosted by the Winter Olympics, which added an incremental $600 million in spending.
Read MoreLevels Of Suspicious US Web & Mobile Traffic, Q1 2013 – Q1 2014 [CHART]
Suspicious US web traffic was down from a high of 61% in Q4 to 55% in Q1, which Solve Media attributes to lower ad spending after the holiday season.
Read MoreGerman Ad Spending By Media, 2010-2013 [TABLE]
German ad spending is expected to rise 2% in 2014.
Read MoreMarketing Expenditures In The Next 5 Years [INFOGRAPHIC]
This infographic is based on data from an Accenture CMO study and illustrates where they thing their marketing dollars will be spent in the next five years.
Read MoreUS Ad Spend Growth By Medium, 2013 vs 2014 [CHART]
Digital media advertising grew to be larger than national TV ad spend last year.
Read MoreTypes Of Programmatic Advertising In The Netherlands, February 2014 [CHART]
89% of Netherlands publishers said they were selling between 51% and 100% of their inventory programmatically.
Read MoreQ1 US Online Ad Revenues, 1996-2014 [CHART]
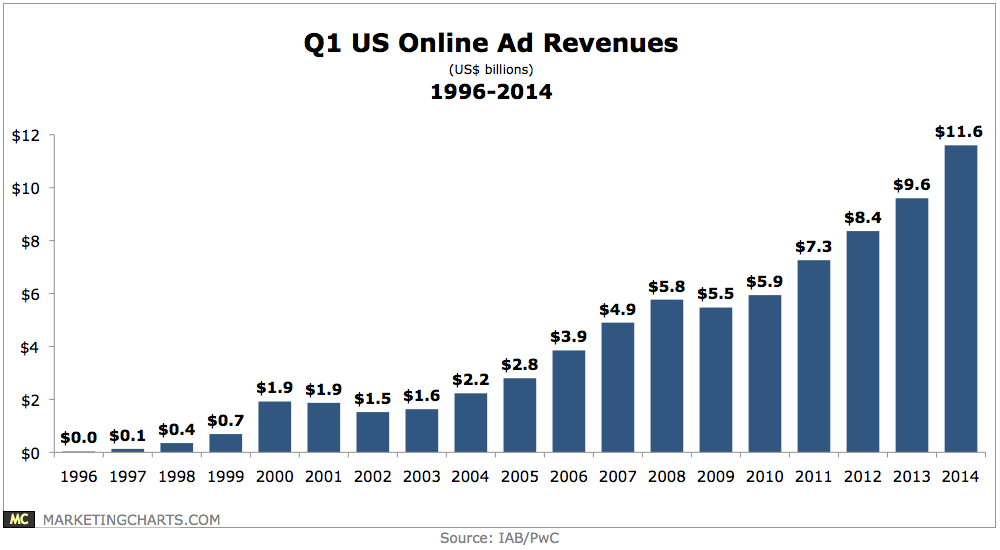
The Q1 mark of $11.6 billion is a new first-quarter peak in online advertising revenues.
Read More