Demographics
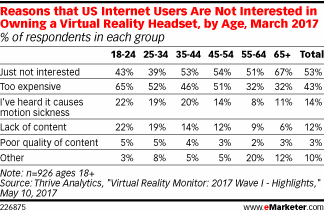
Why People Won't Buy VR Headsets [TABLE]
Cost isn’t the only factor holding back adoption of these virtual reality headsets. Many people are simply not interested in them.
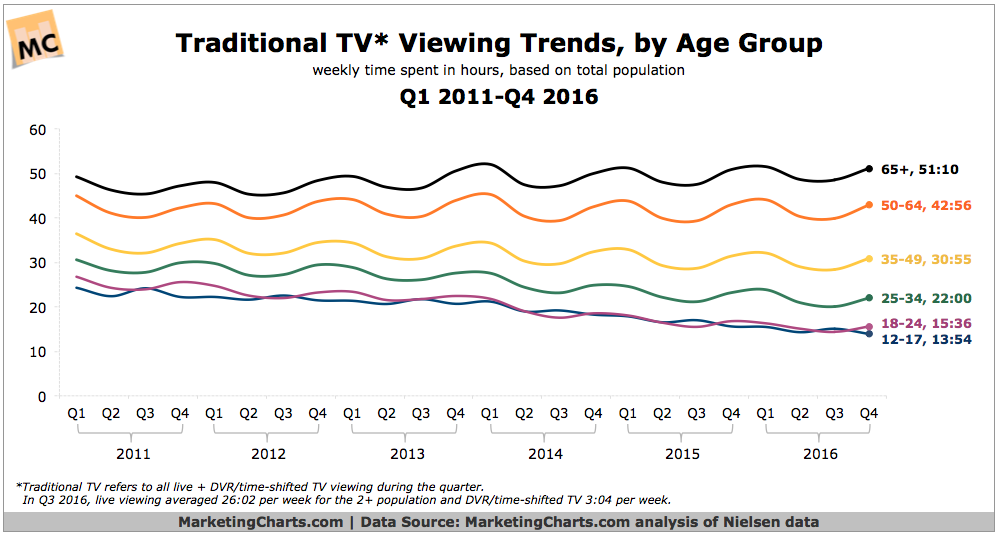
Read MoreTraditional TV Viewing, 2011-2016 [CHART]
Between 2011 and 2016, Q4 traditional TV viewing by 18-24-year-olds dropped by almost 10 hours a week, or by roughly 1 hour and 25 minutes per day.
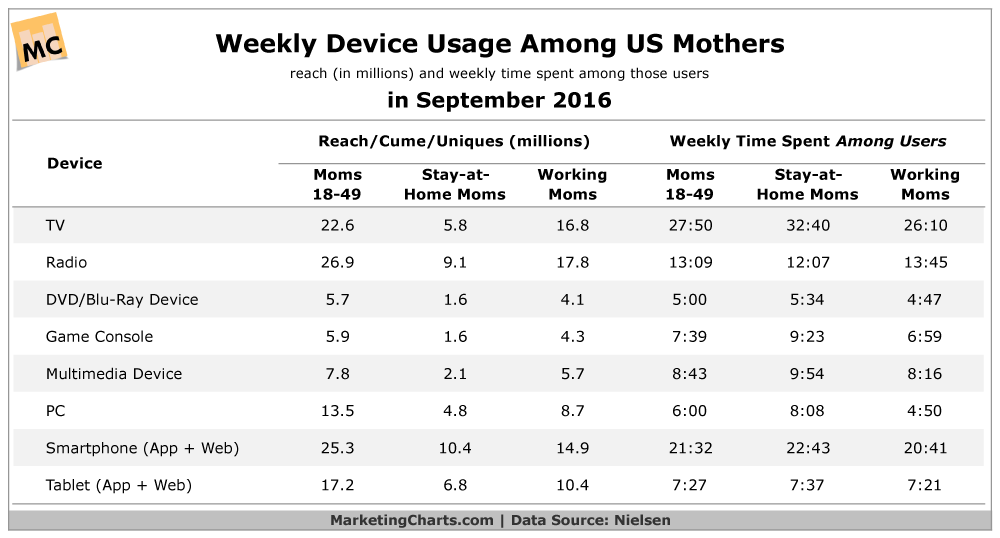
Read MoreTechnographics Of American Mothers [CHART]
Across 10 technologies, ownership levels are universally greater among working than stay-at-home moms.
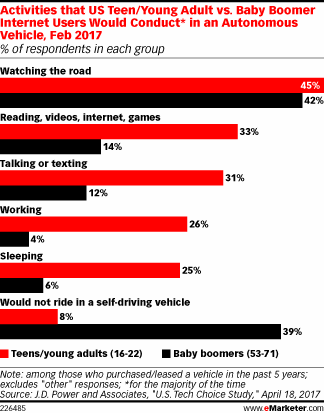
Read MoreAutonomous Driving Activities [CHART]
When asked what activities they would conduct for the majority of time they were in a self-driving car, unsurprisingly, 39% of baby boomers said they would not ride in a self-driving car at all.
Read MoreTrust In Autonomous Vehicles [CHART]
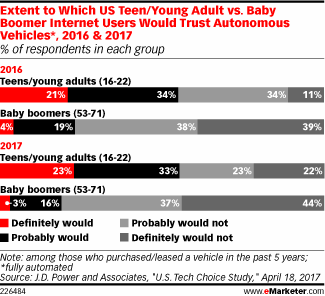
Teens and younger millennials are still more likely to trust self-driving cars, while very few baby boomers do.
Read MoreSnapchat Users By Age [CHART]
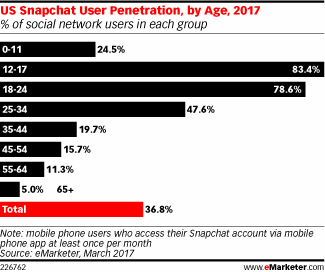
Snap Inc. reported that its daily active user base grew to 166 million in Q1. That’s an increase of 36% over year-ago levels but only a 5% gain from the previous quarter.
Read MoreTeens' News Media Sources [CHART]
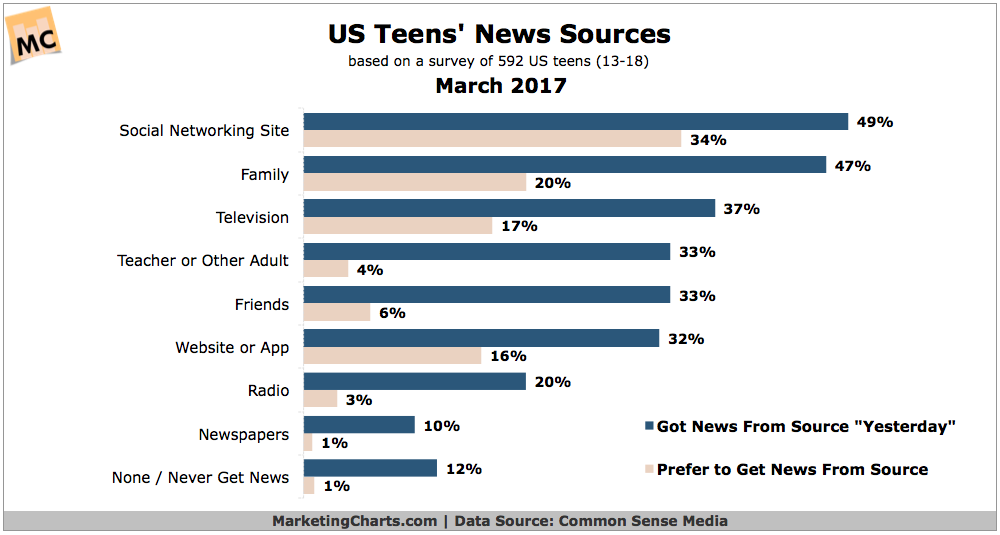
More US teens say they get their news from social networking sites (49%) and family (47%) than from any other source.
Read MoreOnline Reviews & Ratings [INFOGRAPHIC]
This infographic from Websitebuilder.org illustrates the facts and importance of online consumer reviews and ratings to a wide variety of businesses.
Read MoreAverage US Household Size, 1947-2016 [CHART]
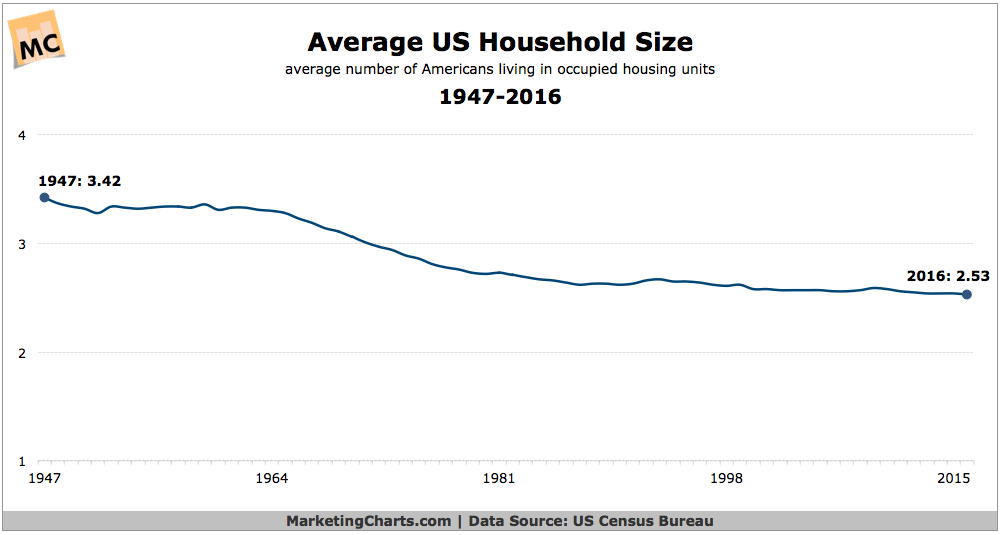
Fully 28% of households now have just one person living in them, more than double the rate from 1960 (13%), reports the US Census Bureau.
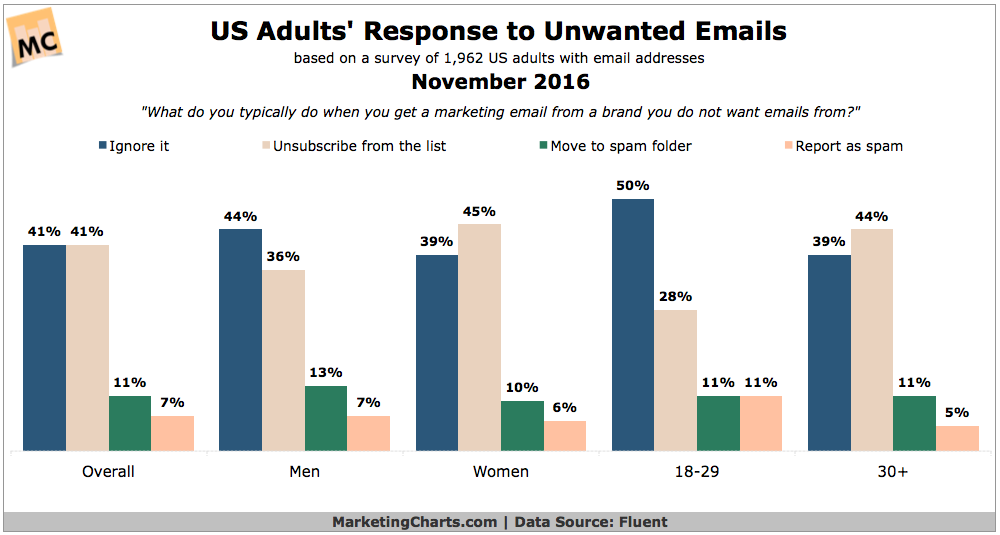
Read MoreHow People React To Spam [CHART]
Faced with a marketing email from a brand they don’t want emails from, US adults are as likely to unsubscribe from the list (41%) as they are to ignore the email (41%).
Read More