Demographics
Oscars 2013 Social TV Chatter On Facebook [INFOGRAPHIC]
This infographic by Facebook illustrates some of the Social Television chatter that occurred during the Oscars broadcast.
Read MoreInteraction With Brands Via Social Media By Generation, February 2013 [CHART]
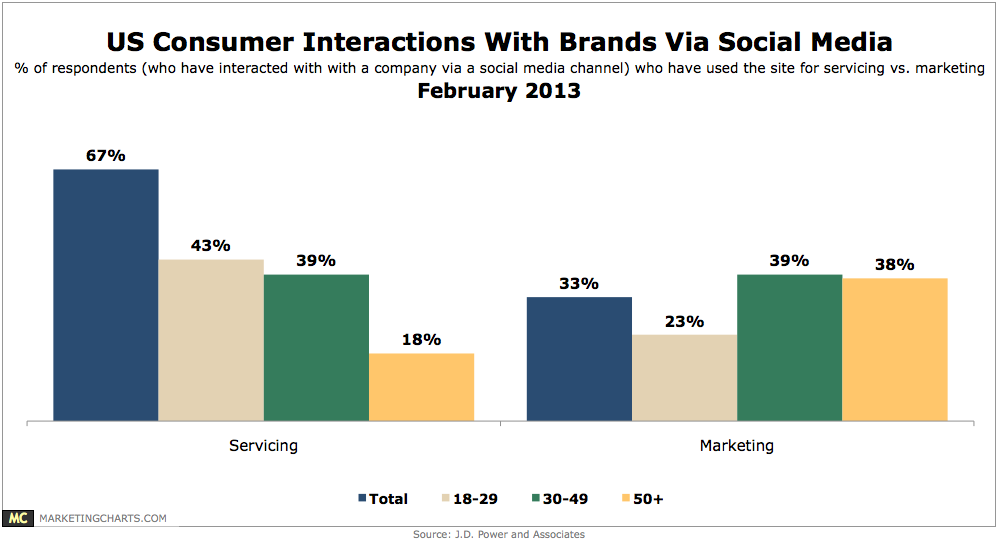
67% of people have have interacted with a company via a social media channel for servicing versus 33% who have done so for marketing.
Read MoreDemographics Of Online Health Care Diagnosis Seekers, September 2012 [TABLE]
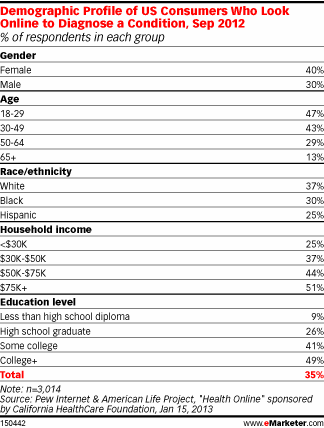
40% of women and 30% of American men relied on the Internet to diagnose medical conditions.
Read MoreTypes Of Health Information Sought Online By Generation & Gender, September 2012 [TABLE]
16% of internet users said they had searched for information on a drug they had seen advertised.
Read MoreOnline Health Seeker Demographics, September 2012 [TABLE]
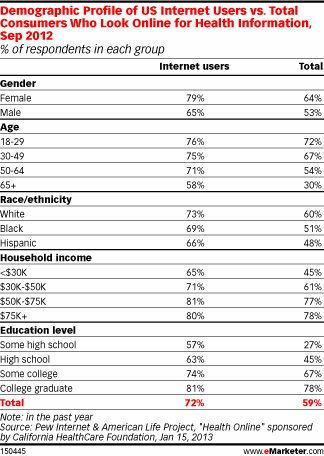
72% of US internet users and 59% of the general population had looked online for health information within the past year.
Read MoreHousehold Shopping Decision Influence Of Hispanic Men, February 2013 [CHART]
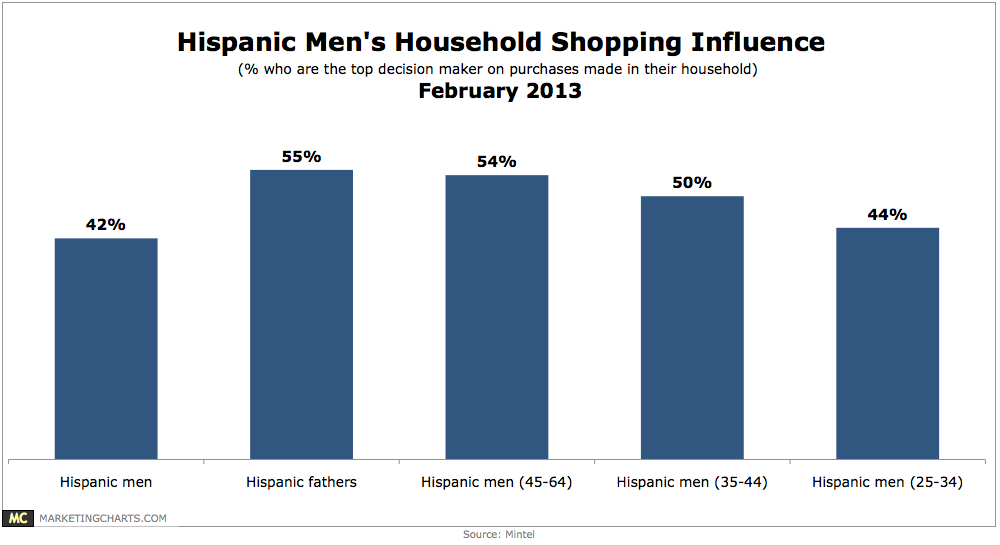
42% of Hispanic men and 55% of Hispanic fathers are the top decision maker for their household’s purchases.
Read MoreSocial Brand Advocate Demographics, February 2013 [TABLE]
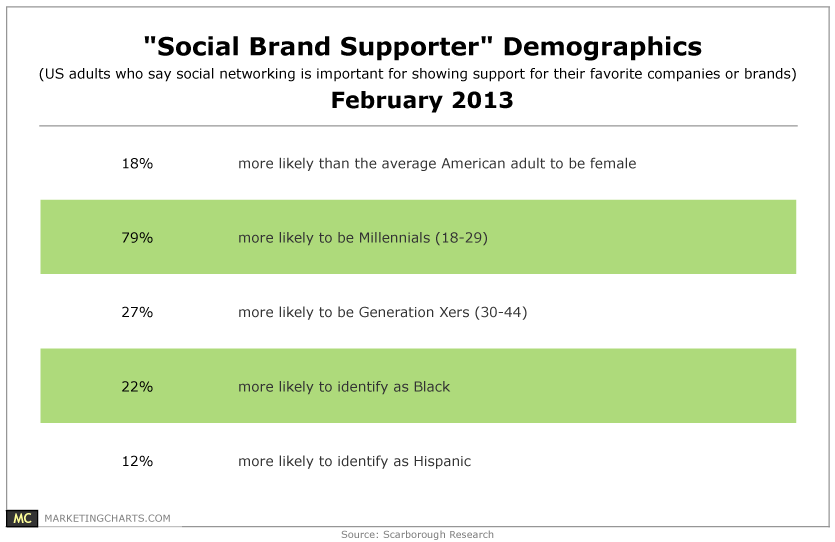
Social media brand advocates are 18% more likely than the average adult to be female, 79% more likely to be Millennials (18-29), and 27% more likely to be Gen Xers (30-44).
Read MoreFacebook User Demographics [TABLE]
Facebook remains the most-used social networking platform, as two-thirds of online adults say that they are Facebook users.
Read MoreTumblr User Demographics [TABLE]
Just 6% of online Americans use Tumblr.
Read MoreInstagram User Demographics [TABLE]
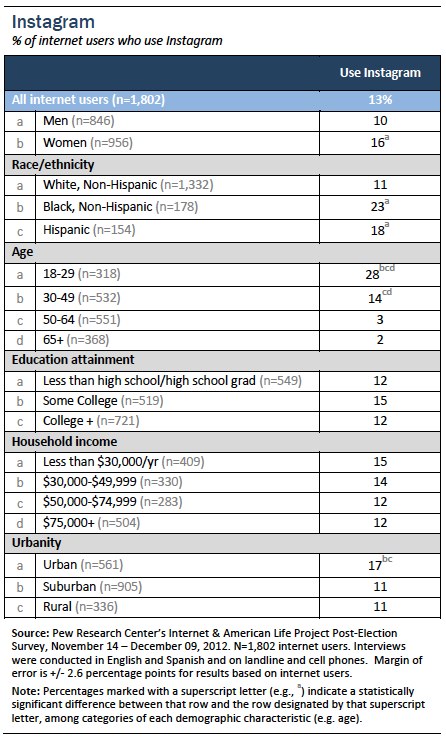
Thirteen percent of internet users are taking and sharing pictures with Instagram.
Read More