Demographics
Twitter Users By Gender, Race & Generation, December 2012 [TABLE]
While 16% of internet users overall said they used Twitter, 26% of black internet users said they did so.
Read MoreFrequency Of College Students' Mobile Purchases, November 2012 [CHART]
70% of college students made mobile purchases, and 52% did so at least once a month.
Read MoreCollege Students' Top Mobile Activities, November 2012 [CHART]
When asked to name their most frequent mobile activity, other than talking or texting, fully 25% of college students cited accessing Facebook.
Read MoreFrequency With Which College Students Find Deals On Mobile Devices, November 2012 [CHART]
Nine out of 10 college students reported using their phones to scour for deals, coupons and specials; just 10% said they never did so.
Read MoreTwitter Sentiment During Final Weeks Of 2012 Presidential Campaign [CHART]
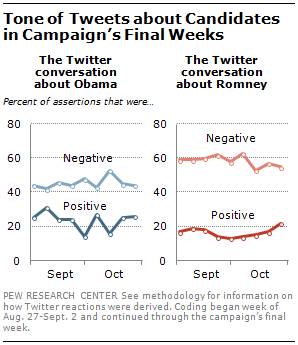
From September through November, Romney was consistently the target of more negative reactions than was Obama.
Read MoreConservative Sentiment On Twitter Compared To Polls [TABLE]
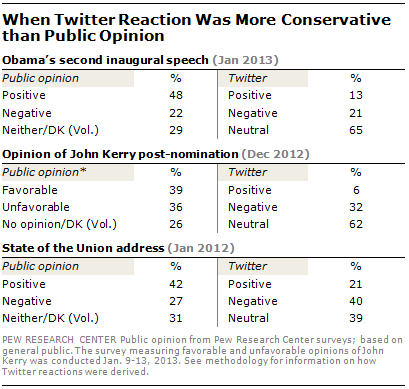
The reaction on Twitter to Obama’s second inaugural address and his 2012 State of the Union was not nearly as positive as public opinion.
Read MoreLiberal Sentiment On Twitter Compared To Polls [TABLE]
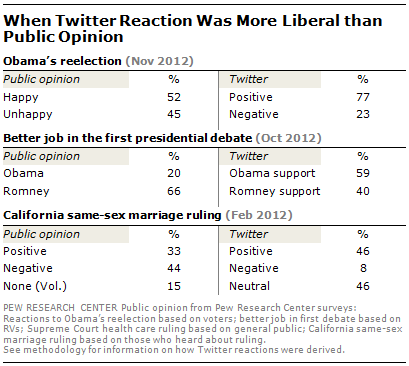
In some instances, the Twitter reaction was more pro-Democratic or liberal than the balance of public opinion.
Read MoreIn-Store Mobile Activities Of African Americans, March 2013 [CHART]
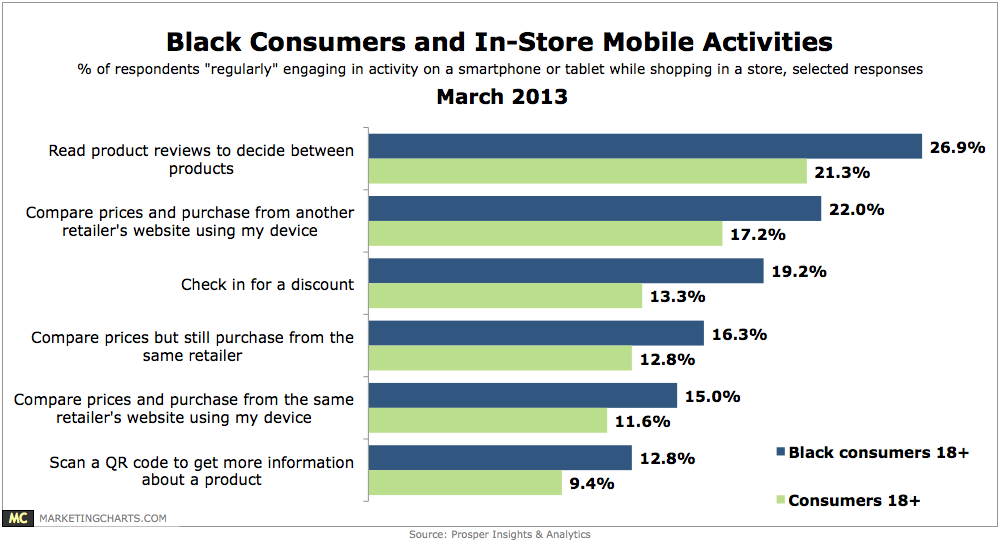
African Americans are 44% more likely to check in for a discount and 37% more likely to scan a QR code to get more information about a product.
Read MoreWomen Who Abandon Social Media, March 2013 [TABLE]
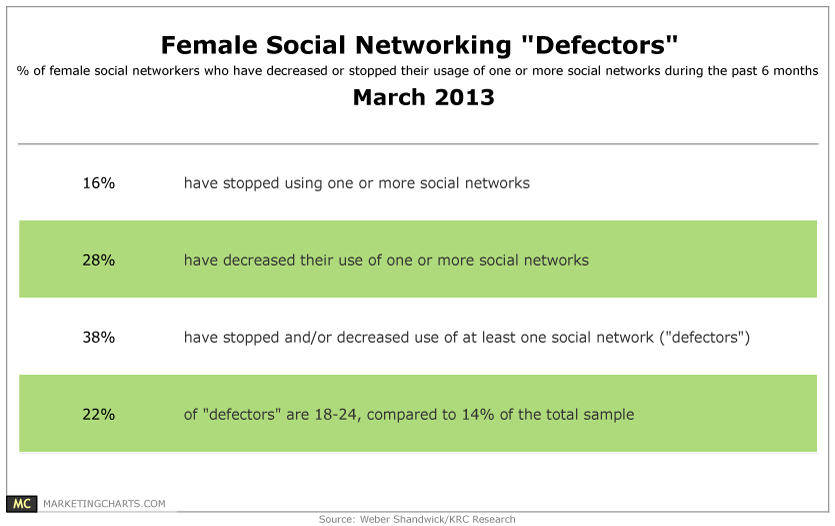
Among the 86% of North American women surveyed online who have a social media account, 38% are dubbed Defectors, who have stopped (16%) and/or decreased (28%) using at least one social network.
Read MoreImportance Of Buying American By Product Category & Gender, March 2013 [CHART]
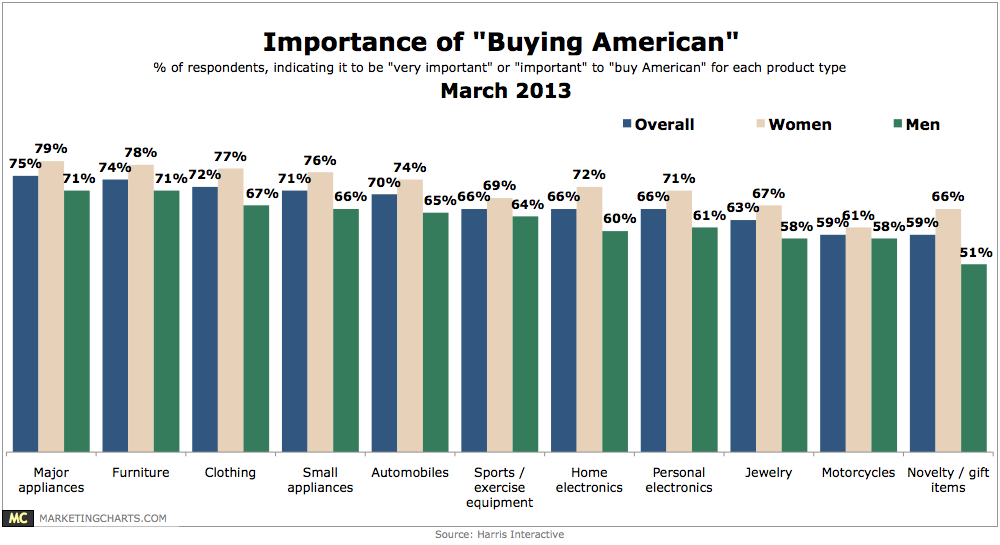
Women were 11% more likely to consider Buying American important when purchasing major appliances (79% vs. 71%).
Read More