Demographics
How American Women Research Products, March 2013 [CHART]
Only 6% of American women reported still researching products primarily in-store, while another 5% asked friends and family for recommendations most often.
Read MoreTeen Spending Behavior, April 2013 [TABLE]
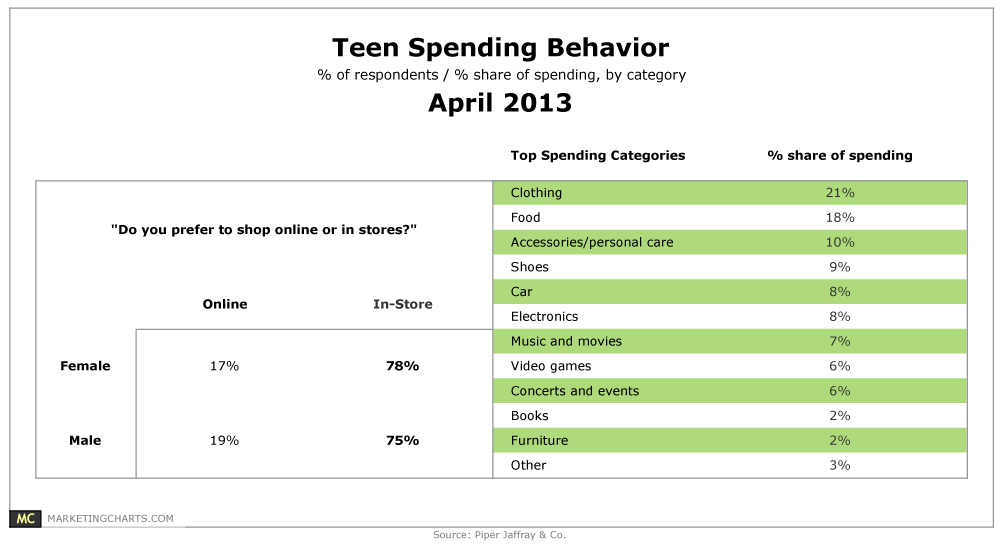
More than 3 in 4 teens shop online.
Read MoreAmericans By Race/Ethnicity, 1990-2018 [CHART]
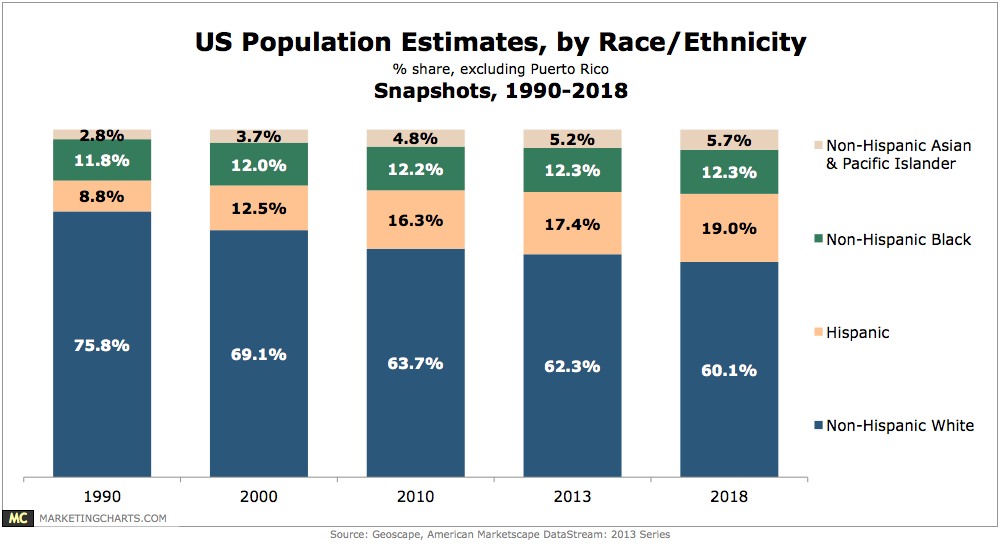
Recent Census Bureau data has highlighted that by 2060, close to 1 in 3 Americans will be Hispanic.
Read MoreMultiscreen Behavior With Facebook & Twitter By Gender, March 2013 [CHART]
Women were slightly more likely than men to turn to social media while watching TV, traveling and exercising, and significantly more likely to do so while shopping.
Read MoreTV Viewership By Daypart, April 2013 [TABLE]
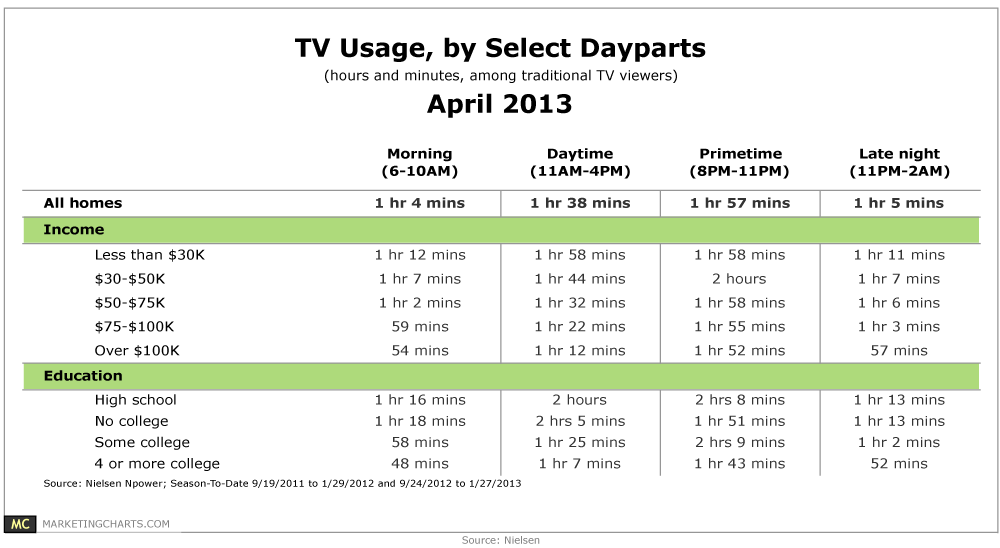
Nielsen’s figures reveal that traditional TV viewers watch close to 2 hours of TV per day during primetime hours, but they spend more than 1-and-a-half hours watching during the daytime hours of 11 AM-3 PM, too.
Read MoreAverage Number Of Facebook Friends By Age, April 2013 [CHART]
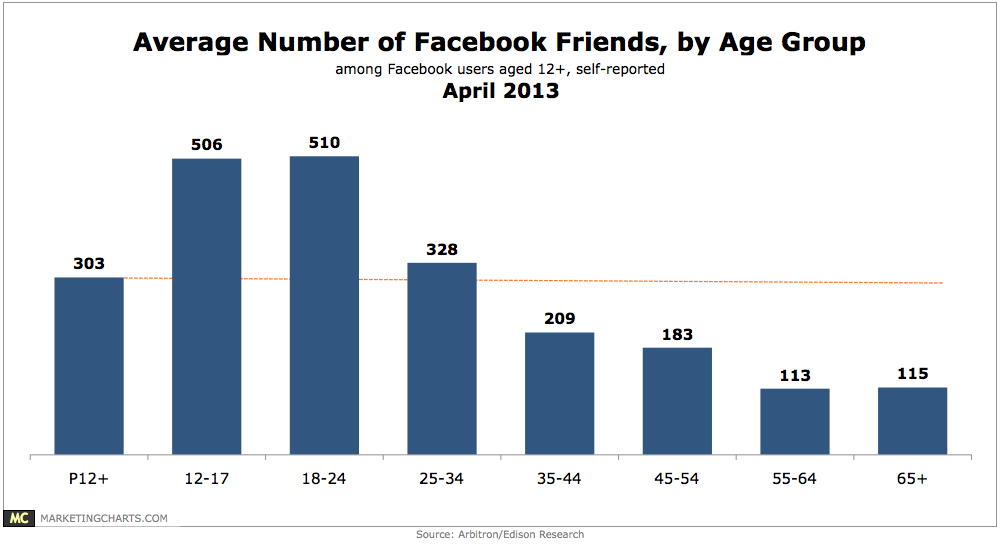
62% of Americans aged 12 and up report having a profile on a social network, and Facebook is easily dominant, used by 58% of Americans of that age.
Read MoreAmerican & Retail Therapy, April 2013 [TABLE]
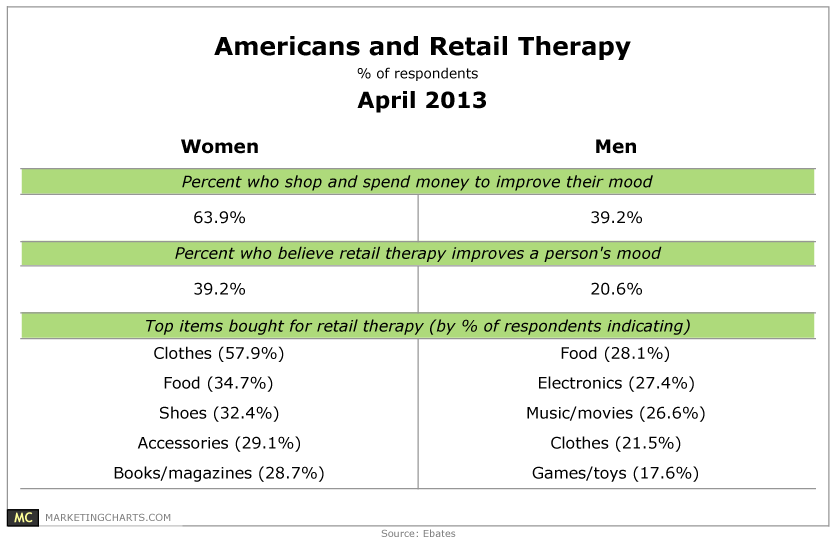
American women are 61% more likely than men to say they shop and spend money to improve their mood.
Read MoreGaps In Customer Profiles, April 2013 [CHART]
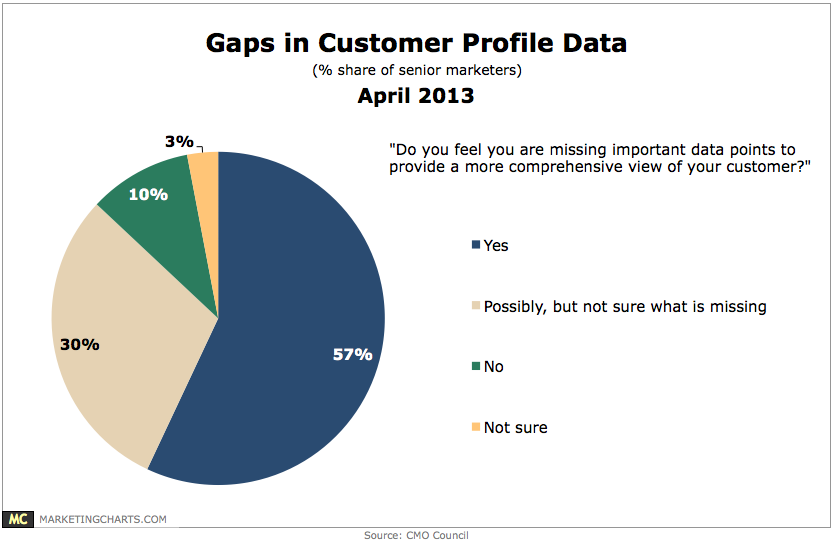
57% of marketers feel that they are missing important data points that could provide them with a more comprehensive view of their customer.
Read MoreLikely Cable To Streaming Video Subscription Switchers [TABLE]
12% strongly agreed with the statement: I would consider replacing my cable subscription with a streaming media subscription (e.g., Netflix, Hulu Plus) in 2013.
Read MoreParents & Family Entertainment Spending, March 2013 [TABLE]
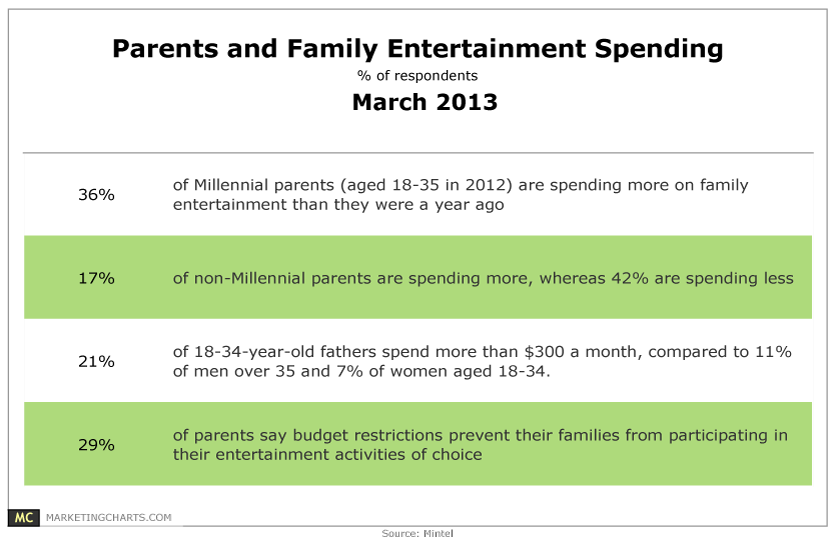
Millennial (18-35 in 2012) parents are twice as likely as non-Millennial parents to say they’re spending more on family entertainment than they were a year ago (36% vs. 17%).
Read More