Demographics
Millennials' Changing Alcoholic Beverage Preferences, 1992-1994 vs 2012-2013 [CHART]
60% of American adults drink alcohol at least occasionally.
Read MoreHealth Care Pros Who Use Multiple Devices On The Job By Specialty, May 2013 [CHART]
The informational needs of doctors and other health care providers have likely helped to push the adoption of mobile devices.
Read MoreDevices Health Care Professionals Use On The Job, 2012 & 2013 [CHART]

A May 2013 survey of US health care practitioners found that 86% of them had used a smart phone for professional purposes in 2013, up from 78% the previous year.
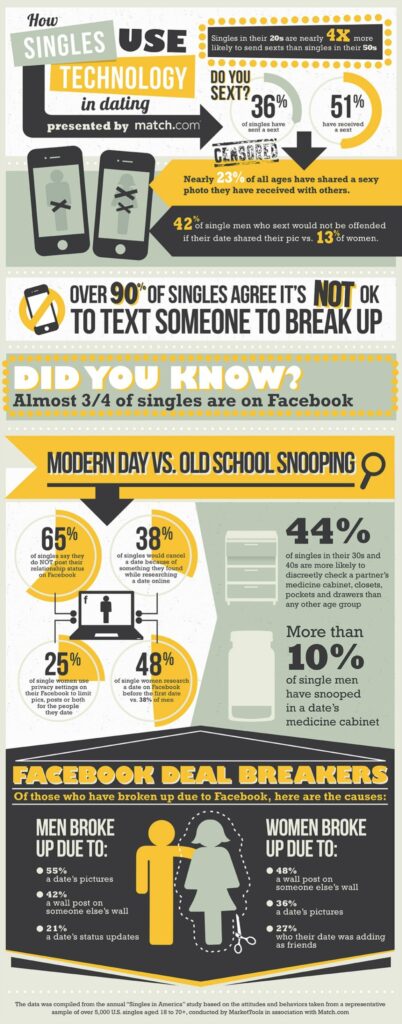
Read MoreDemographics Of Social Media Users [INFOGRAPHIC]
This infographic from DocStock (via Ragan.com) illustrates the demographics of social media users.
Read MoreDemographics Of Mobile In-Store Price Comparers, January 2013 [TABLE]
12% of US mobile phone owners in the 50-to-64 age group had used those devices in the prior 30 days to compare prices in-store.
Read MoreDemographics Of Online Price Comparers For Big Ticket Purchases, May 2013 [TABLE]
Two-thirds of US internet users ages 50 to 69 agreed “strongly” with the statement, “When making a big or expensive purchase, I search online to compare prices across stores or retailers.”
Read MoreDemographics Of Brand-Sponsored Online Contest Participants, August 2013 [CHART]
52% of American female internet users say they’ve entered an online contest or sweepstakes sponsored by a brand or product.
Read MoreTwitter Users By Demographic, May 2013 [TABLE]
Between November 2010 and May 2013, the percentage of internet users on Twitter more than doubled for every adult age group except those ages 65 and older.
Read MoreLatina Television Viewing, 2003 vs. 2013 [CHART]
Over the past decade or so, Hispanic women have moved away from English broadcast TV, cutting their consumption almost by half.
Read MoreQR Code Scanners By Generation & Gender, Q2 2013 [CHART]
64% of scanners in Q2 were male, fairly unchanged from 65% in Q1 of this year and 68% in Q1 2012.
Read More