Demographics
Media Consumption Of LGBT Americans, June 2013 [TABLE]
The most common activity among the men and women polled was visiting LGBT sites and blogs, at 67% of gays and 58% of lesbians.
Read MoreLocation-Based Services Demographics, May 2013 [CHART]
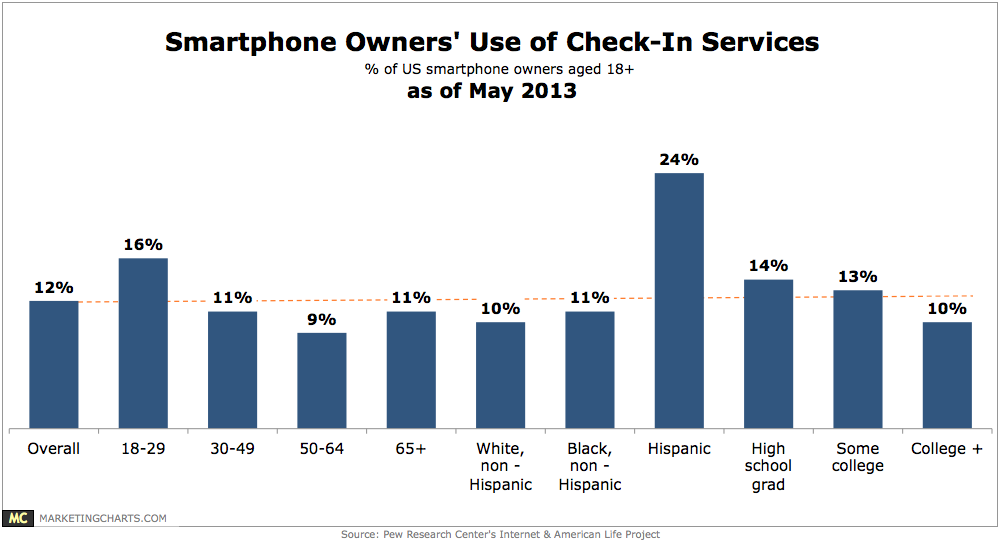
12% of smart phone owners use services such as Foursquare to “check in” to certain locations or to share their locations with their friends.
Read MoreUS College Student Demographics [CHART]
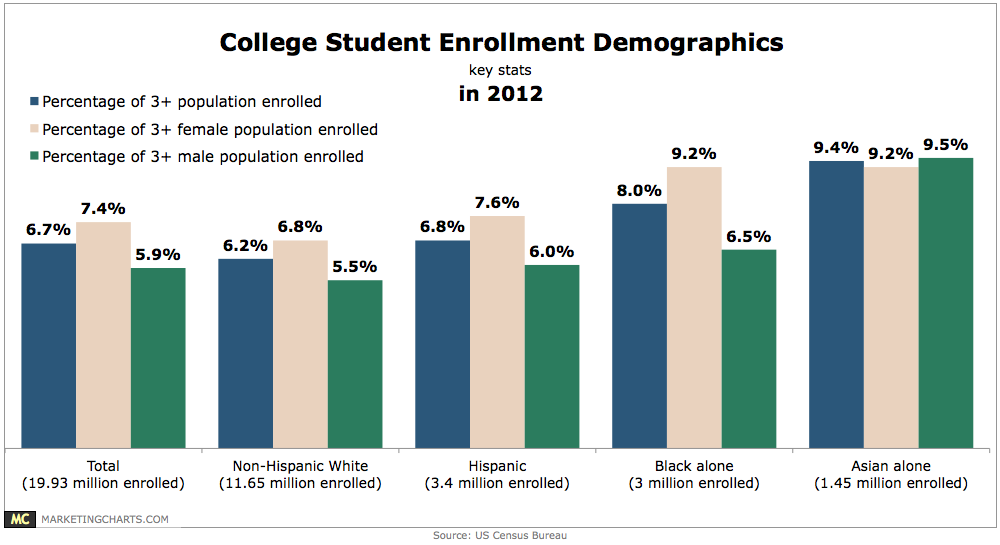
After growing by 3.2 million between 2006 and 2011, the number of Americans enrolled in college (undergraduate and graduate) fell by almost half-a-million last year.
Read MoreDevice Ownership By Income Level, September 2013 [CHART]
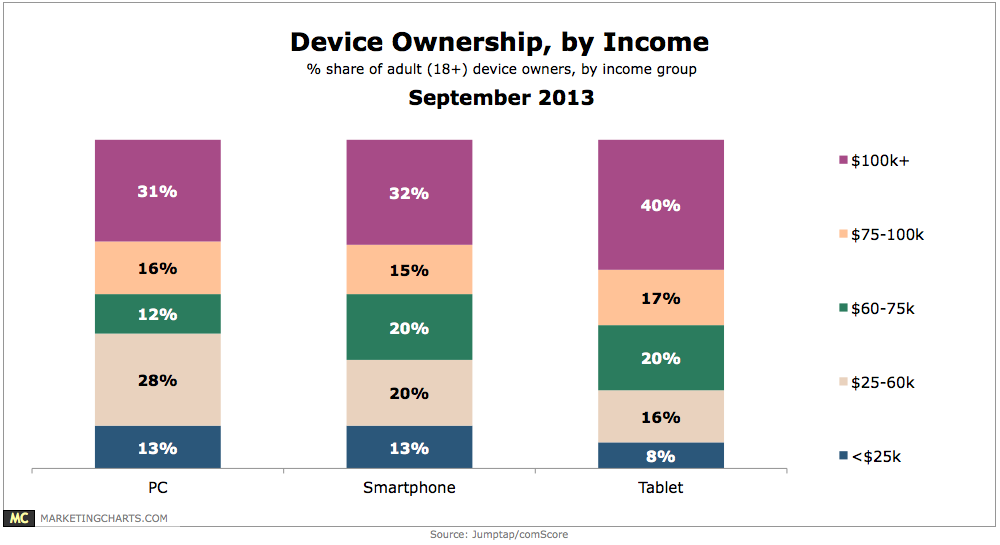
Tablet owners tend to have higher incomes than smart phone and PC owners.
Read MoreUS Digital Cross-Platform Audience, April 2013 [CHART]
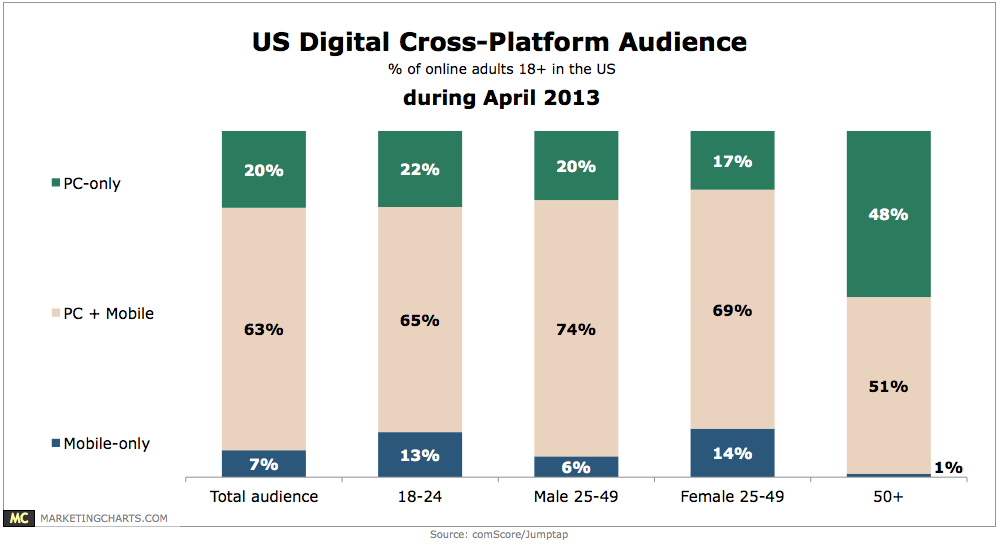
The number of adults going online is 194 million strong per month. Of those, about 63% (122 million) use both a PC and a mobile device.
Read MoreShare Of Time Spent Online By Device, April 2013 [CHART]
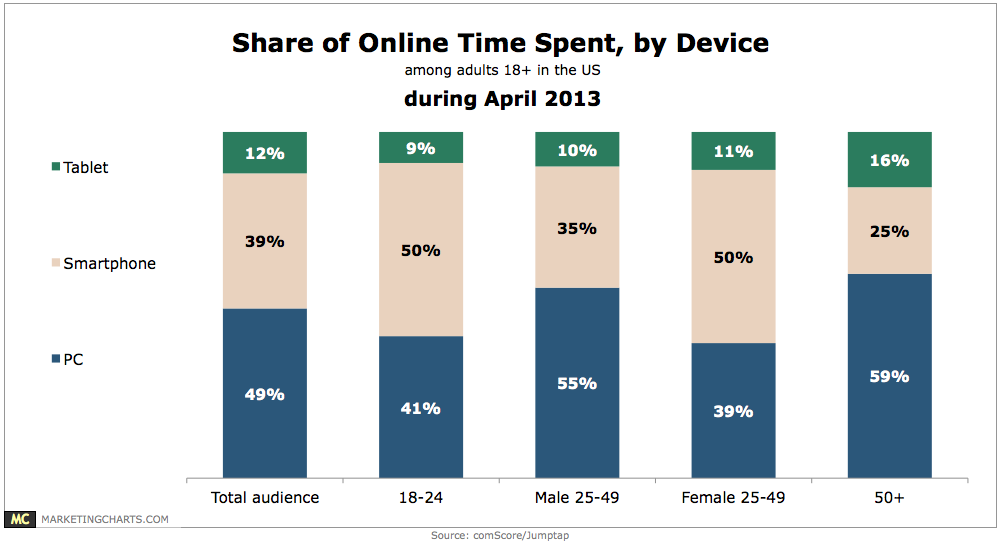
Soaring smart phone and tablet use has doubled the amount of time Americans spend online in the matter of a few short years.
Read MoreUS Household Types, 1970-2012 [CHART]
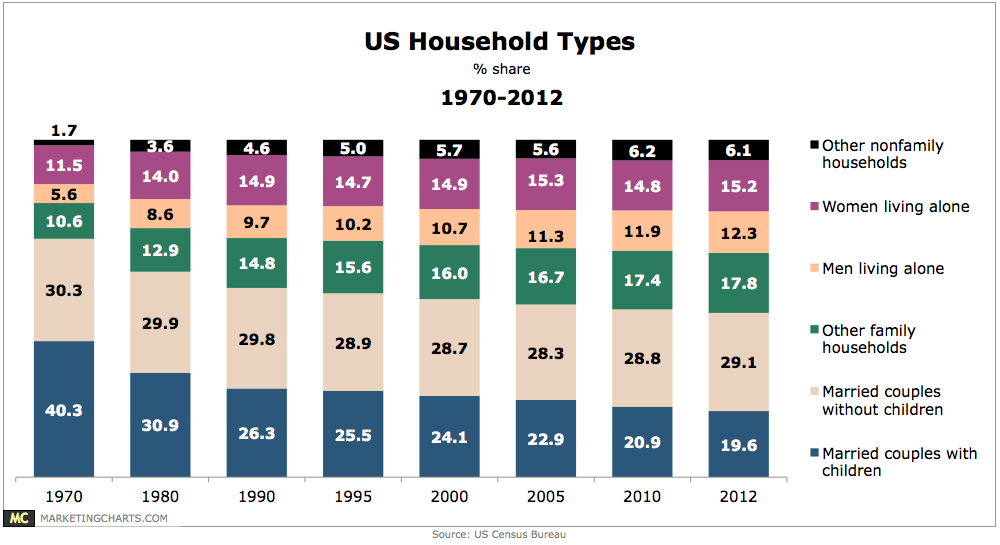
The constitution of the American household has evolved considerably in the past 4 decades or so, such that there really is no typical household type anymore.
Read MoreHousehold Income Of Feature Phone Users, August 2013 [CHART]
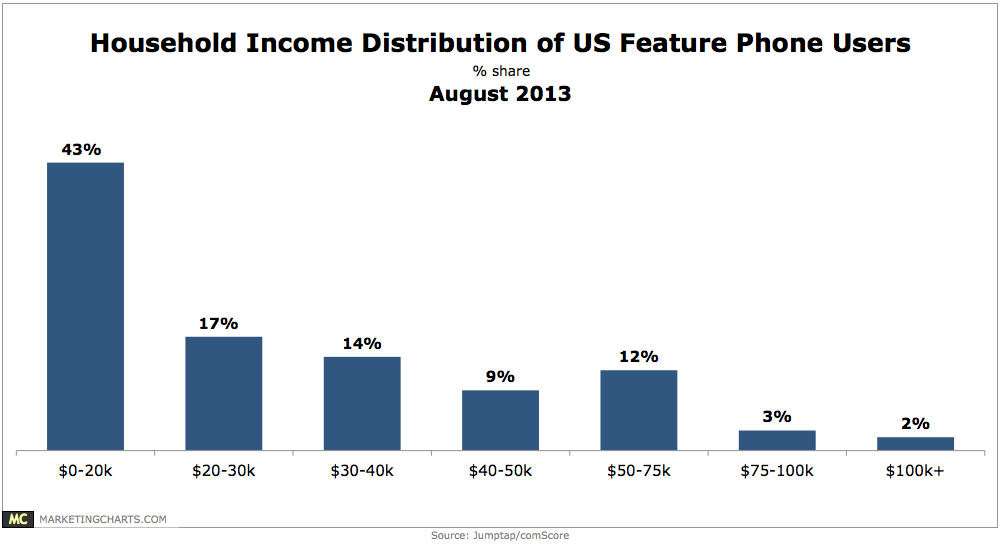
Fully 43% of feature phone owners come from households with annual income levels of $20,000 or less.
Read MoreBrand- & Product-Related Content Sharing By Demographics, August 2013 [CHART]
11% of online Americans have forwarded a link to a brand or product’s video to someone.
Read MoreEmail Click Frequency By Gender, August 2013 [CHART]
Consumers open emails throughout the day, but only click through those emails at specific preferred times, and those windows are often short.
Read More